Max Est. MMI
18 km NE of Upper Lake, CA
Ground Shaking Intensities — Interpolated ShakeMap MMI
3 sites| Location | MMI Description |
|---|---|
|
Upper Lake
CA |
Weak(II) |
|
Nice
CA |
Weak(II) |
|
Lucerne
CA |
Weak(II) |
Seismic Station Observed MMI
MMI values are derived directly from observed ground motion measurements at seismic stations and are not spatially interpolated.
| Station | MMI Description |
|---|---|
| Bevans Ridge (BK.BEVN) | Weak(III) |
| Trough Springs/Crackerbox Ridge, CA 95979 (BK.GTSB) | Weak(III) |
| Hogback Ridge (NC.GHGB) | Weak(III) |
Engineering Ground Motion Parameters
GMPE predictions provide an independent check on the ShakeMap interpolated intensities above.
ShakeMap relies on seismic station recordings; in areas with sparse station coverage — or
for large teleseismic events and earthquakes outside dense West Coast networks — ShakeMap
MMI can be inaccurate. A significant difference between ShakeMap and GMPE estimates is a signal
that the ShakeMap result should be treated as preliminary.
Also includes site Vs30 values and raw ground motion parameters (PGA/PGV).
Show ▼
Engineering Ground Motion Parameters
GMPE predictions provide an independent check on the ShakeMap interpolated intensities above. ShakeMap relies on seismic station recordings; in areas with sparse station coverage — or for large teleseismic events and earthquakes outside dense West Coast networks — ShakeMap MMI can be inaccurate. A significant difference between ShakeMap and GMPE estimates is a signal that the ShakeMap result should be treated as preliminary. Also includes site Vs30 values and raw ground motion parameters (PGA/PGV).
Est. Vs30 Values
Estimated shear-wave velocity in the upper 30 m used in GMPE calculations. Ref. column shows the 760 m/s rock-site reference for comparison.
| Location | Ref. (760 m/s) | Est. Vs30 (m/s) |
|---|---|---|
|
Upper Lake
CA |
760 | 228 |
|
Nice
CA |
760 | 733 |
|
Lucerne
CA |
760 | 228 |
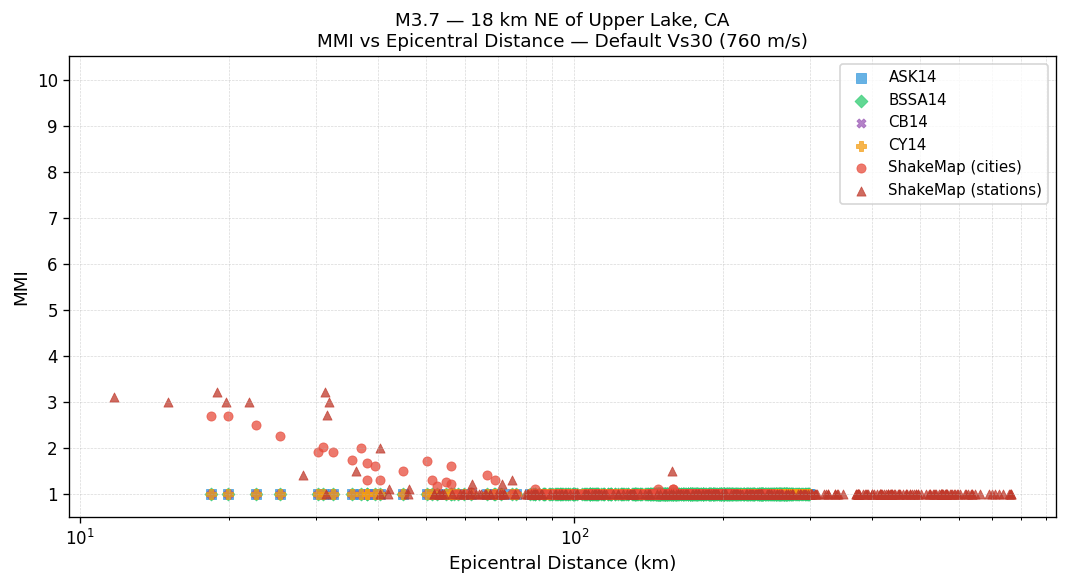
MMI vs Distance — Default Vs30 (760 m/s)
All methods using the 760 m/s rock-site reference. ShakeMap values are independent of Vs30.
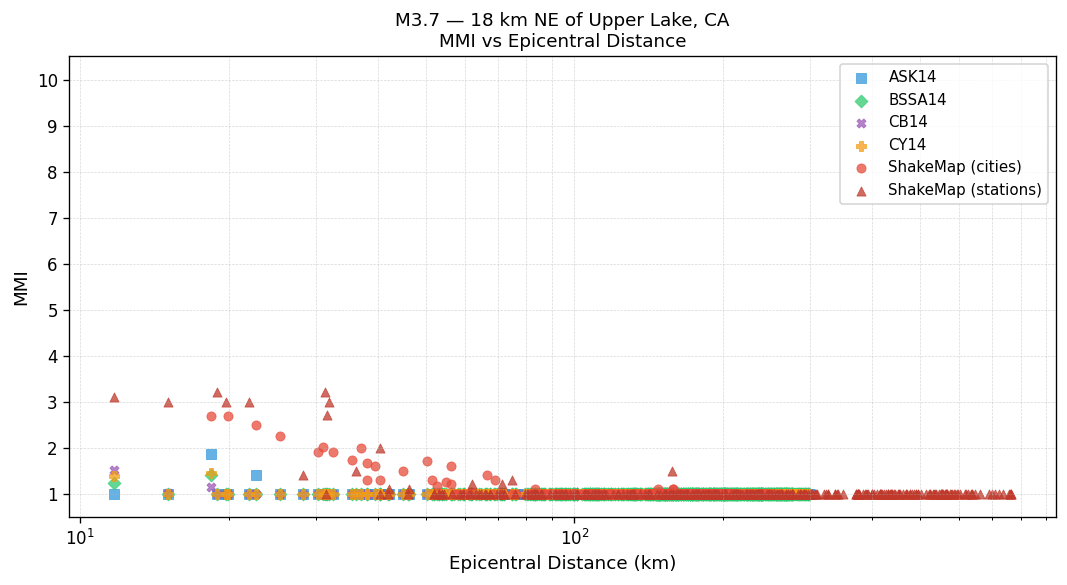
MMI vs Distance — Est. Vs30
GMPEs use the Est. Vs30 values shown in the table above. ShakeMap values are independent of Vs30.
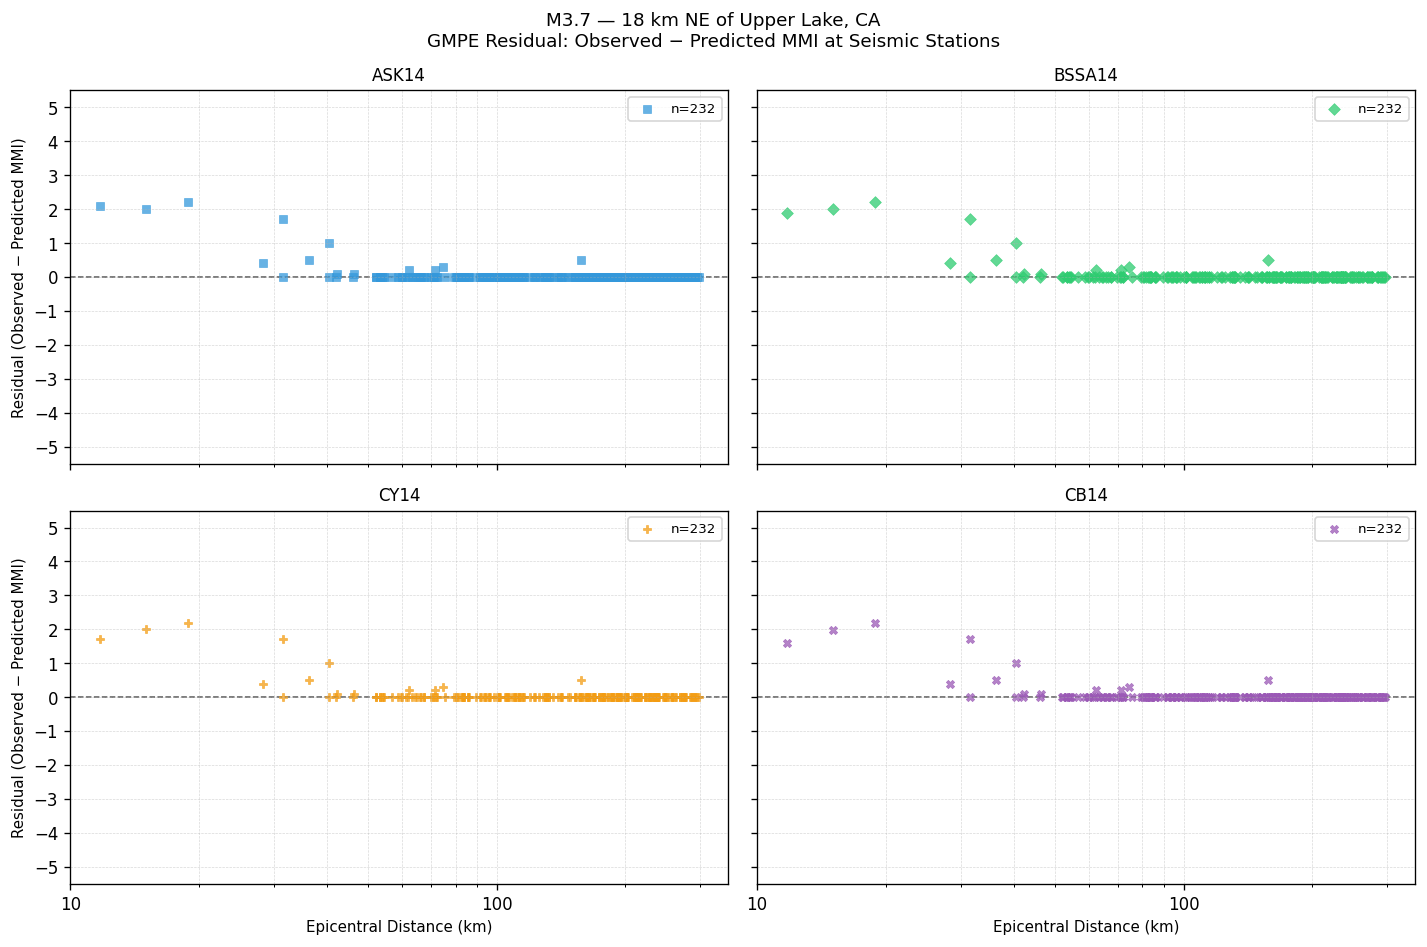
GMPE Residual — Observed − Predicted MMI
Signed residual at each seismic station. Positive values mean the GMPE underestimated shaking; negative values mean it overestimated. The dashed line at zero indicates perfect agreement.
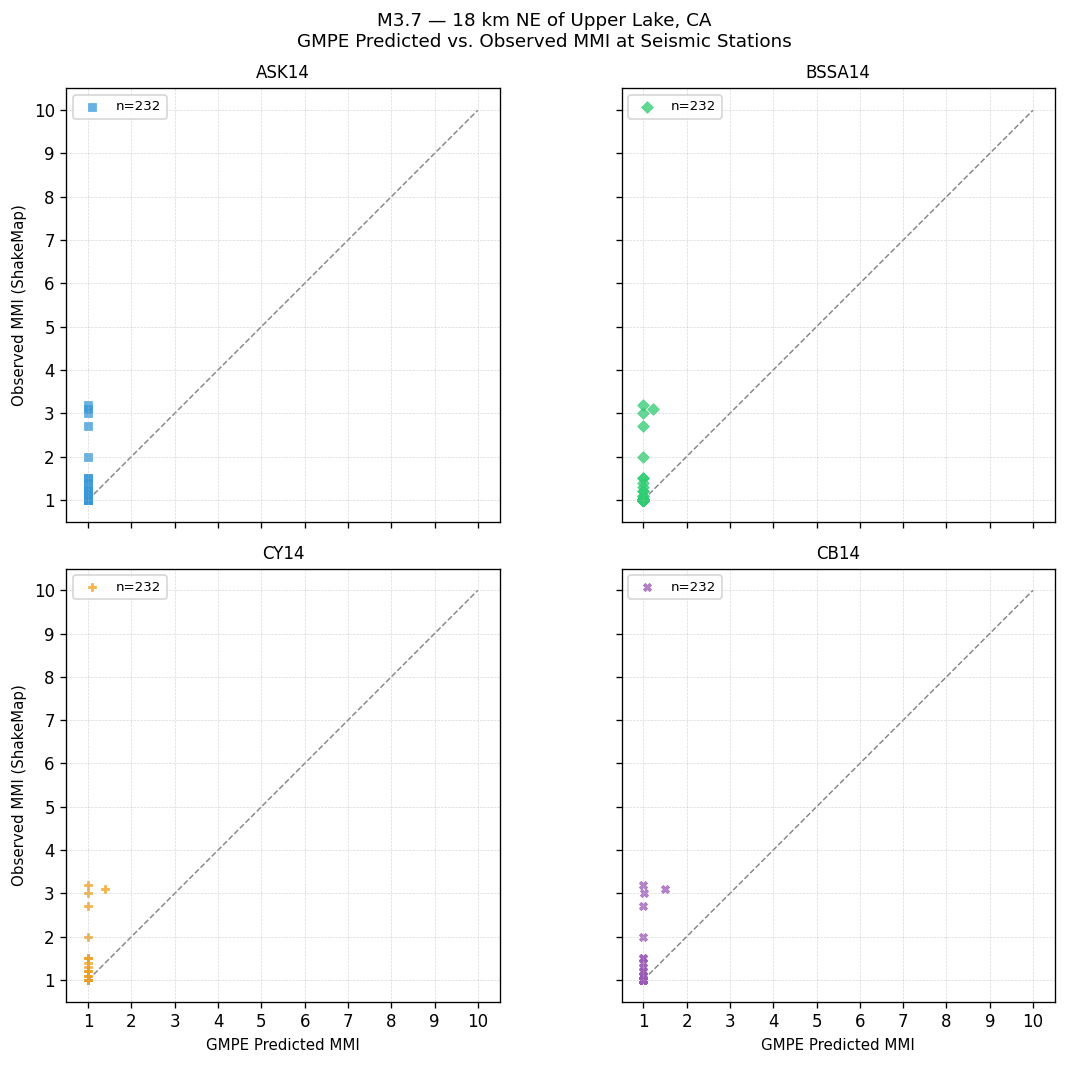
GMPE Predicted vs. Observed MMI at Seismic Stations
Each point is one seismic station. Points on the dashed 1:1 line indicate perfect agreement; above the line = GMPE underestimated shaking; below = overestimated.
GMPE Performance — Station Observations
Statistics computed by comparing each GMPE's predicted MMI against ShakeMap observed MMI at seismic stations. Bias = mean(observed − predicted). Lower RMSE indicates better overall agreement with instrumental measurements.
| GMPE | Bias | Sigma | RMSE |
|---|---|---|---|
| ASK14 | +0.05 | 0.27 | 0.28 |
| BSSA14 | +0.05 | 0.27 | 0.27 |
| CY14 | +0.05 | 0.26 | 0.27 |
| CB14 | +0.05 | 0.26 | 0.26 |
Peak Ground Motion — Seismic Station Observations
Recorded PGA and PGV at seismic stations, sorted by highest PGA. Top 25 stations shown. MMI (PGA) and MMI (PGV) are independent conversions via Worden et al. (2012) GMICE.
| Station | PGA (g) | MMI (PGA) | PGV (cm/s) | MMI (PGV) |
|---|---|---|---|---|
| Hogback Ridge (NC.GHGB) | 0.0093 | Weak(II) | 0.280 | Weak(III) |
| Trough Springs/Crackerbox Ridge, CA 95979 (BK.GTSB) | 0.0064 | Not felt(I) | 0.198 | Weak(II) |
| Bevans Ridge (BK.BEVN) | 0.0054 | Not felt(I) | 0.239 | Weak(II) |
| Cow Mountain (NC.GCWB) | 0.0028 | Not felt(I) | 0.118 | Weak(II) |
| Round Top Mountain (NC.GRT) | 0.0011 | Not felt(I) | 0.047 | Not felt(I) |
| Barra Winery, Redwood Valley, CA (BK.BARR) | 0.0008 | Not felt(I) | 0.029 | Not felt(I) |
| Grizzly Island (NC.NGI) | 0.0008 | Not felt(I) | 0.008 | Not felt(I) |
| Thermalito Afterbay Dam (WR.THER) | 0.0006 | Not felt(I) | 0.006 | Not felt(I) |
| Lloyd Lowery (NC.NLL) | 0.0005 | Not felt(I) | 0.016 | Not felt(I) |
| Clifton Court Forebay South (WR.CLFS) | 0.0004 | Not felt(I) | 0.011 | Not felt(I) |
| Lawrence Livermore National Laboratory (BK.LLNL) | 0.0004 | Not felt(I) | 0.002 | Not felt(I) |
| Navarro Ridge (NC.GNR) | 0.0004 | Not felt(I) | 0.022 | Not felt(I) |
| Hamilton Opening (NC.GHO) | 0.0004 | Not felt(I) | 0.022 | Not felt(I) |
| Circle K Ranch (WR.CKR) | 0.0004 | Not felt(I) | 0.004 | Not felt(I) |
| Van Arsdale (NC.GVA) | 0.0003 | Not felt(I) | 0.014 | Not felt(I) |
| Beacon Light (NC.GBL) | 0.0003 | Not felt(I) | 0.016 | Not felt(I) |
| Pine Mountain #1 (NC.GPM) | 0.0003 | Not felt(I) | 0.012 | Not felt(I) |
| Wonder Ranch (NC.GWR) | 0.0003 | Not felt(I) | 0.018 | Not felt(I) |
| Bald Mountain (NC.NBM) | 0.0003 | Not felt(I) | 0.015 | Not felt(I) |
| Hull Mountain (BK.HULL) | 0.0003 | Not felt(I) | 0.024 | Not felt(I) |
| Snow Mountain (NC.GSN) | 0.0003 | Not felt(I) | 0.016 | Not felt(I) |
| Bradford Ranch, Boonville, CA (BK.BONV) | 0.0003 | Not felt(I) | 0.014 | Not felt(I) |
| Spanish Creek (BK.SPAN) | 0.0003 | Not felt(I) | 0.015 | Not felt(I) |
| Wildwood Ranch (NC.GWW) | 0.0002 | Not felt(I) | 0.016 | Not felt(I) |
| Fire Station 31 (NP.1690) | 0.0002 | Not felt(I) | 0.003 | Not felt(I) |