Animations
Seeing what an intensity value means
Intensity scales describe observations of physical motion. We put the motion itself into a physics simulator and show what it does to an ordinary room.
Browse the collections
Recently produced
All animations →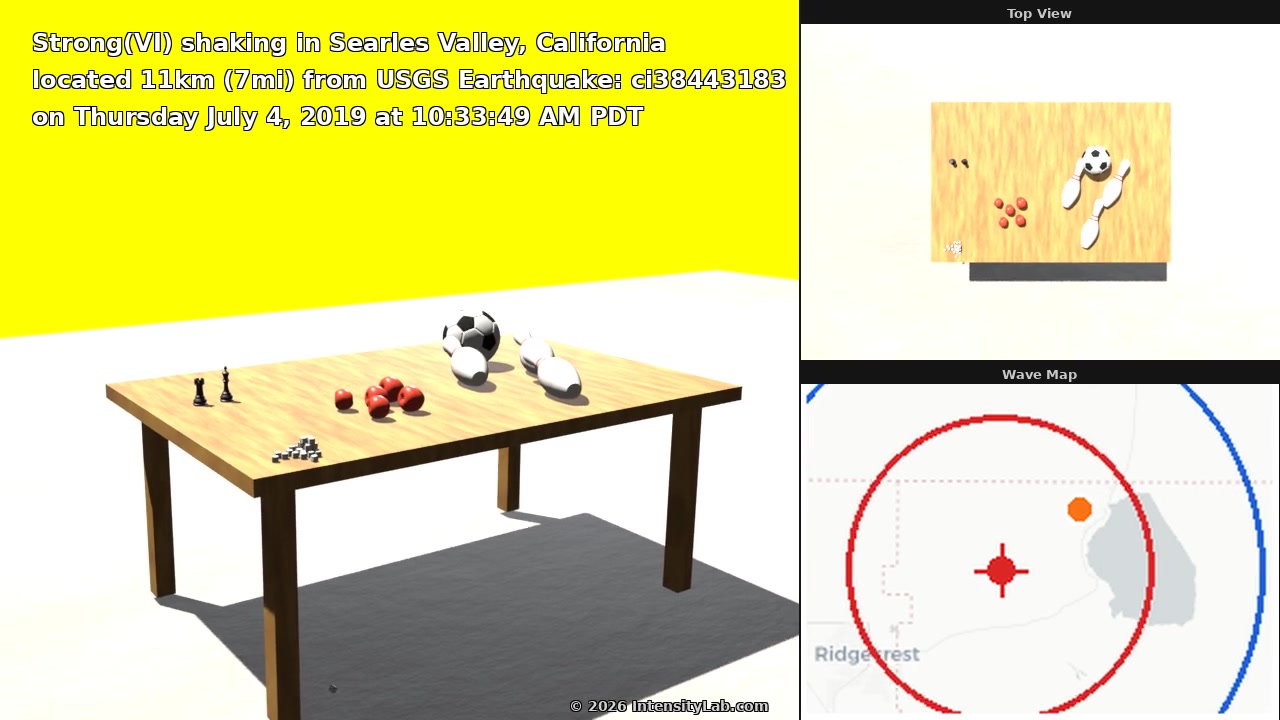
M6.4 · Ridgecrest Earthquake Sequence
City · Tabletop · Simulated
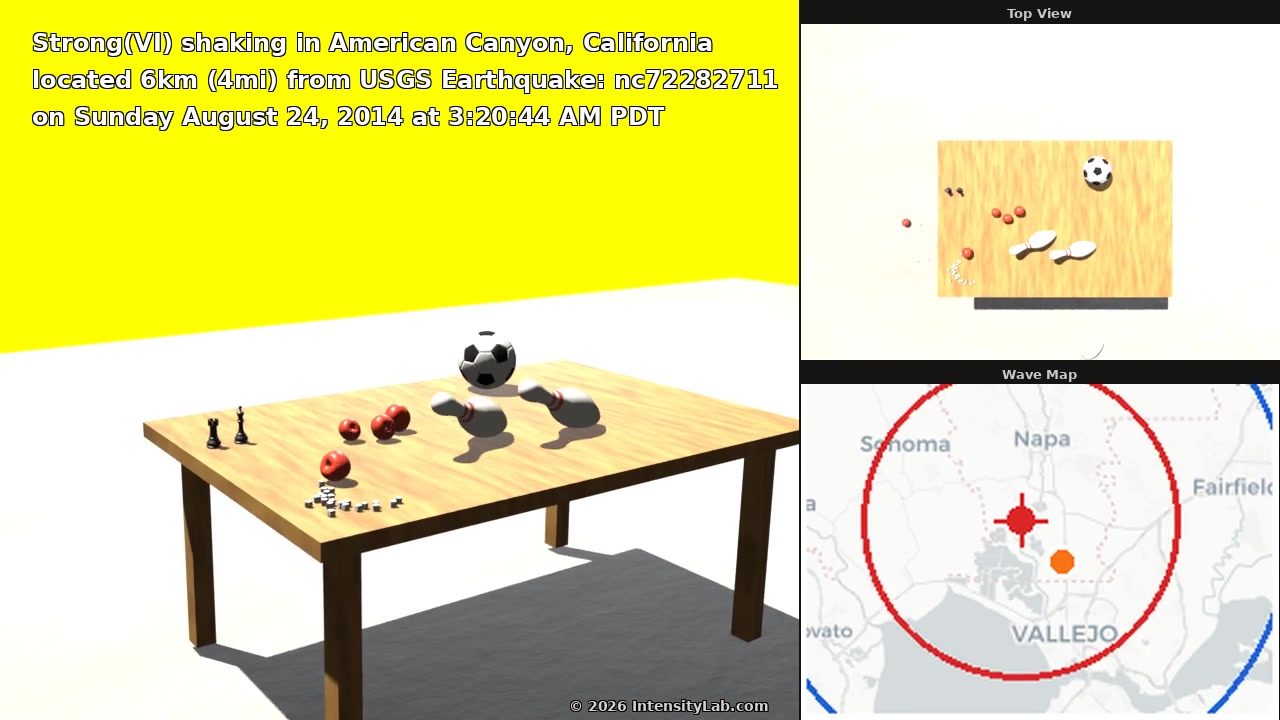
M6.0 · The 2014 South Napa, California Earthquake
City · Tabletop · Simulated
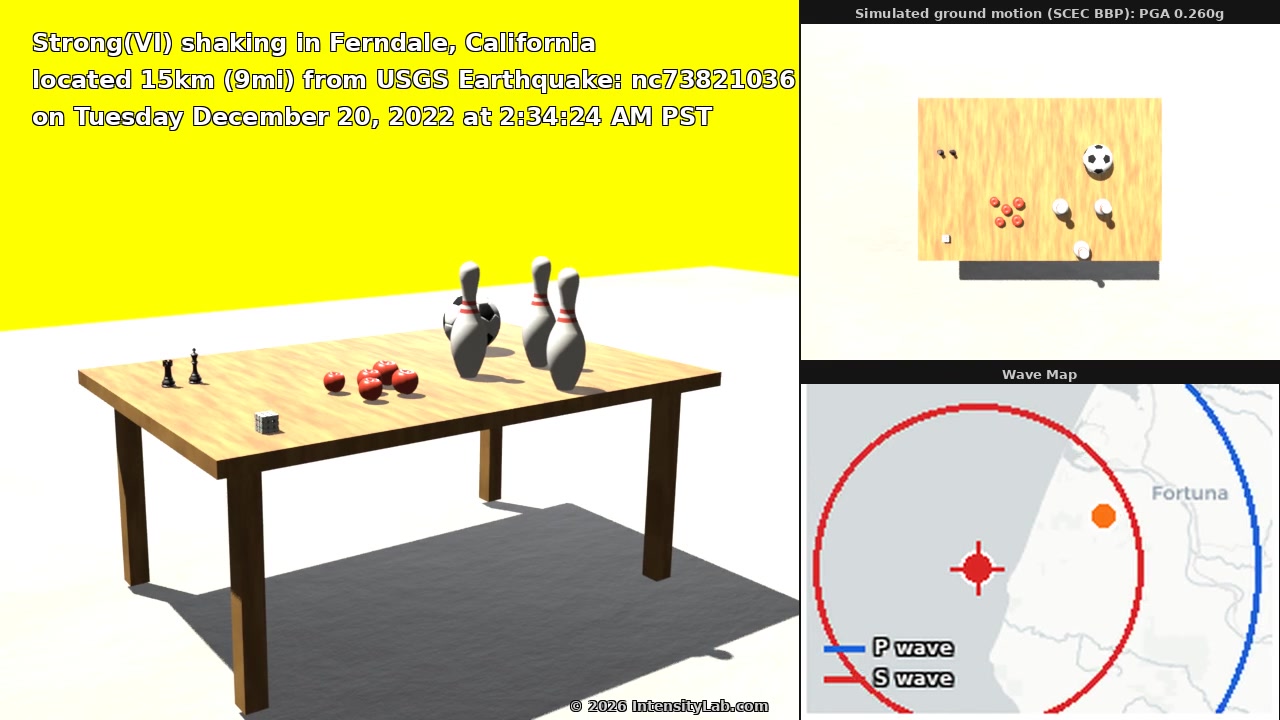
M6.4 · 15km WSW of Ferndale, CA
City · Tabletop · Simulated
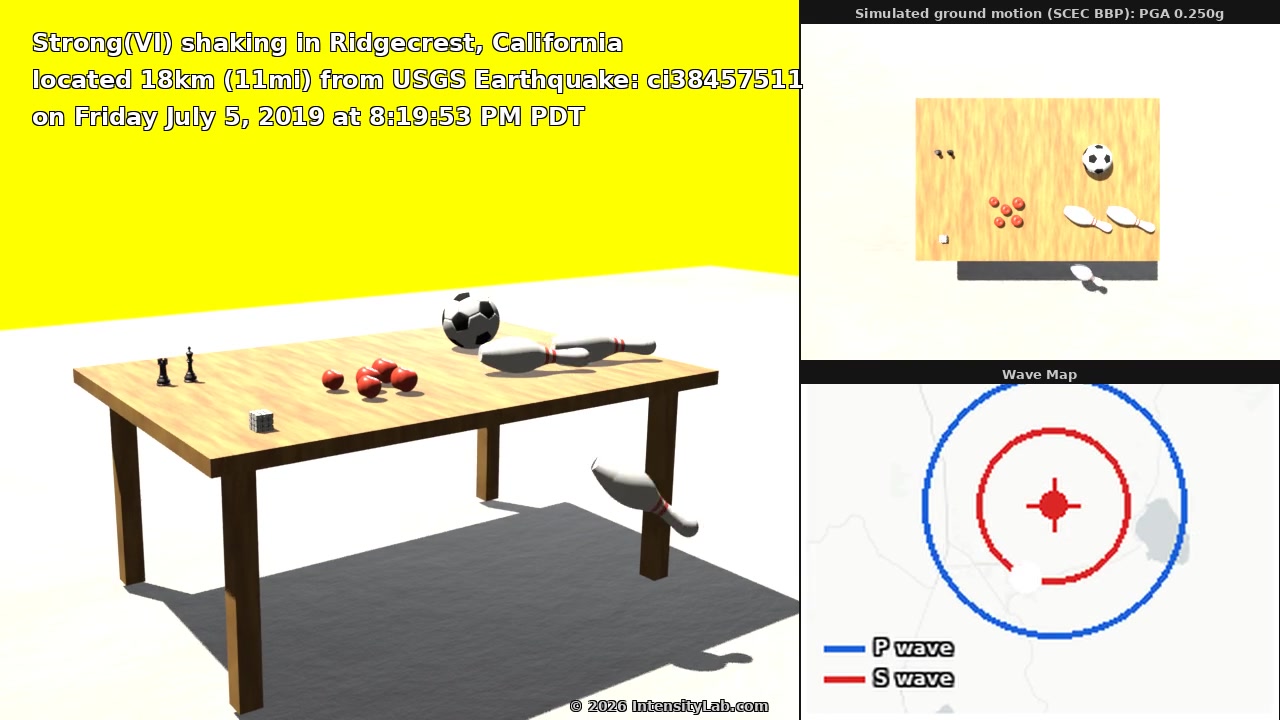
M7.1 · Ridgecrest Earthquake Sequence
City · Tabletop · Simulated
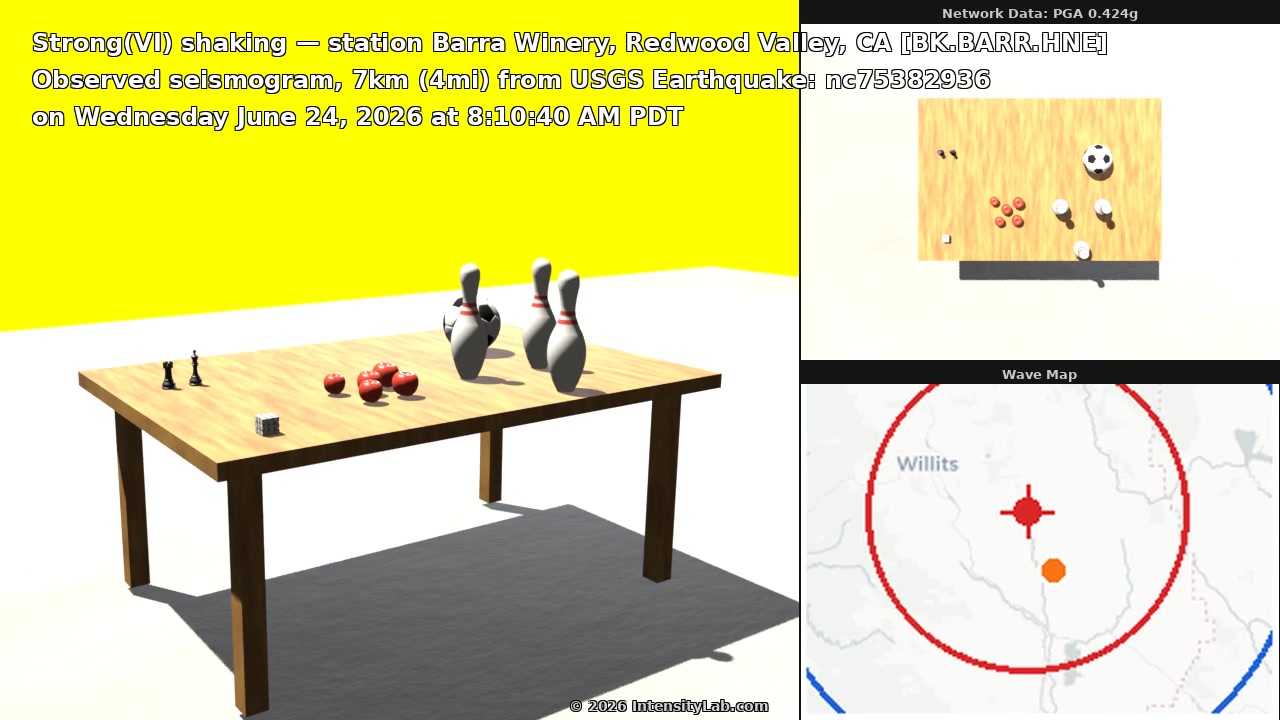
M5.6 · 11 km N of Redwood Valley, CA
Station · Tabletop · Observed
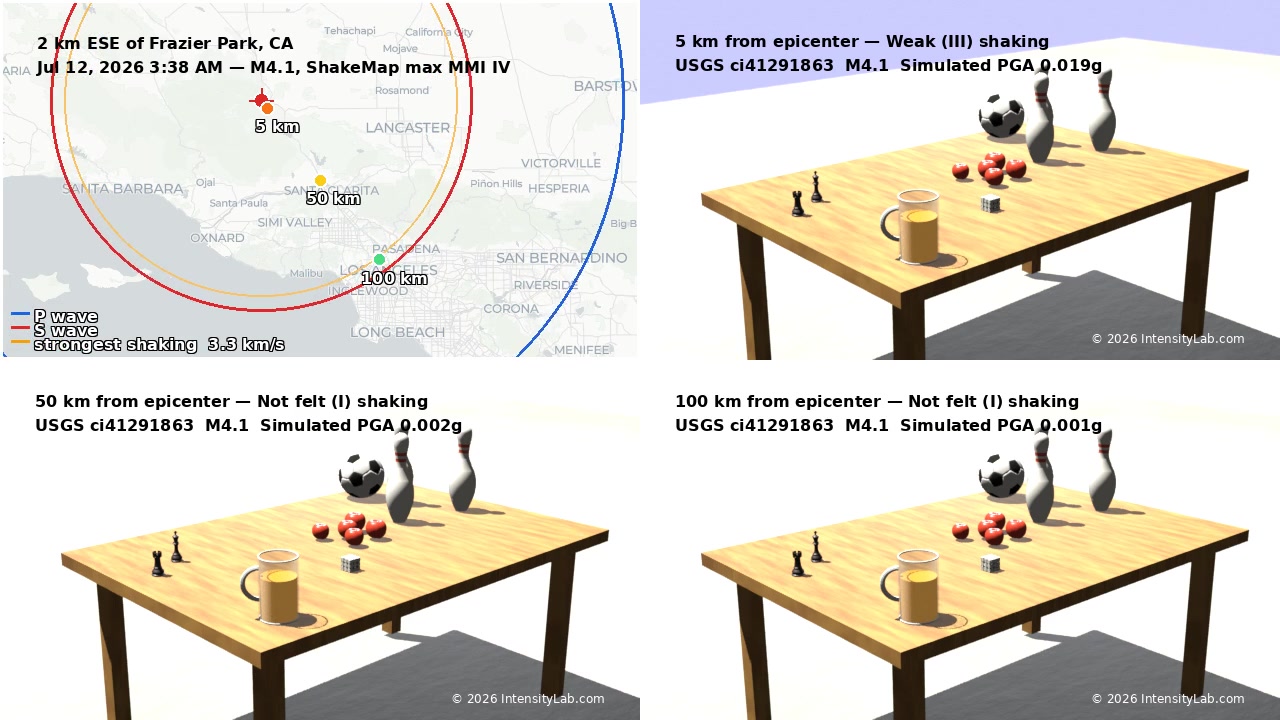
M4.1 · 2 km ESE of Frazier Park, CA
Decay · Tabletop · Simulated
Strong ground motion is a record, not a single value
During strong shaking the ground does not move by one amount. It accelerates back and forth many times a second, and it keeps doing so for seconds or minutes. The complete measurement of that motion — acceleration sampled hundreds of times a second, in three directions — is a ground motion time series, or seismogram. It is what seismometers record and what engineers analyse.
An intensity value such as MMI VII, or a peak acceleration in %g, reduces that entire record to one number. That is the right thing to do for a map, and it is what our event pages report. But a great deal is lost in the reduction: two earthquakes can produce the same peak and behave nothing alike.
Duration and frequency are the difference. A brief, sharp pulse can rattle objects and leave them standing. Sustained shaking of the same peak amplitude, repeated over half a minute, is what topples furniture and damages structures — energy delivered again and again rather than once. Every animation on this page is driven by the full record, which is why it can show that difference at all.
Why a simulation, not just a prediction equation
A ground motion prediction equation (GMPE) answers a narrow question: given a magnitude, a distance and a site condition, what is the median peak acceleration — or spectral acceleration at one period — and how much scatter is there around it? The answer is a handful of numbers at a point. That is enough to shade a map, and it is what most rapid shaking products report.
A ground motion simulation answers a larger one. It returns a full three-component time series — the actual motion of the ground, second by second, in all three directions. Everything a scalar leaves out is in there:
- Duration. Two sites can share a peak acceleration and shake for ten seconds or for sixty. Damage does not care only about the largest cycle.
- Frequency content. A structure responds at its own period. A time series says what energy arrived near that period; a single peak value cannot.
- Arrival and sequence. P-wave, S-wave, surface waves, and the gap between them — which is what makes a simulated record look and behave like a recording rather than a bar chart.
- Near-field and directivity effects. Rupture propagating toward a site produces large velocity pulses that a distance-based regression averages away.
- Basin response. Sedimentary basins trap and amplify long-period energy in a way that depends on the wave path, not just on the site's VS30.
That output is what an engineer needs for a response-history analysis, and it is what drives the shaking animations published here — neither is possible from a peak value alone. A physics engine has to be told where the ground is at every frame; there is nothing to hand it in a single number.
There is a second difference, about where each method's confidence comes from. A GMPE is a regression fitted to recorded earthquakes, so it is best constrained where recordings are plentiful — moderate magnitudes at moderate distances — and thinnest exactly where the stakes are highest: large ruptures, close in. A Broadband Platform seismogram is instead computed, propagating a kinematic rupture model through a regional crustal velocity model, so it is not limited to the magnitude-distance range that happens to be well sampled.
The simulated seismograms behind these animations are produced on the SCEC Broadband Platform through the BBP API, and the verification and validation evidence for that service is published separately.
One standard environment
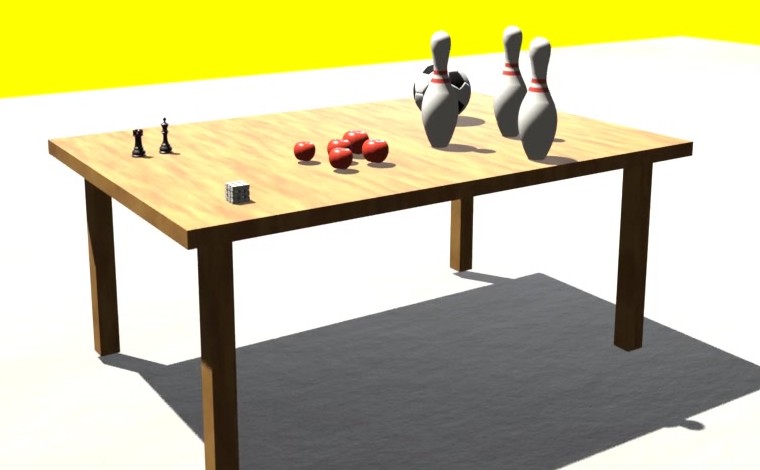
Every animation uses the same scene, so the only thing that differs between two videos is the ground motion driving them. A wooden kitchen table carrying familiar objects of known size and weight: put two animations side by side and any difference you see is the earthquake, not the set dressing.
Dice
A stacked block of standard 16 mm casino dice. Light, and the first thing to scatter.
Chess pieces
A rook and a king. Tall, narrow, and sensitive to how hard the table is pushed sideways.
Soccer ball
Rolls rather than tips, which makes the direction and duration of the shaking visible.
Bowling pins
Regulation pins, weighted low. They need real shaking to fall, so they mark the higher intensities.
Apples
A cluster of five, each about 8 cm and 180 g. They roll off the table under moderate shaking.
The objects are simulated as rigid bodies with their real masses, friction, and centers of mass. Nothing is animated by hand: the floor and table are driven by the ground motion time series, and everything on the table responds to that. Full technical description →
Three types of animation
Same scene, three different questions about the same earthquake.
Simulated ground motion
City
The shaking at the population center closest to the epicenter, using simulated ground motions calculated with the SCEC Broadband Platform. Most towns have no seismometer in them, so simulation is how we answer "what did it do here" for a place with no instrument of its own.
Watch these →Observed ground motion
Station
The shaking at the seismic station closest to the epicenter, using observed ground motions retrieved from FDSN data services. This is a real recording of a real earthquake, with the instrument response removed, driving the table.
Watch these →Simulated ground motion
Decay
The same earthquake at 5 km, 50 km, and 100 km from the epicenter, side by side, using simulated ground motions calculated with the SCEC Broadband Platform. One magnitude, three very different experiences, which is the whole argument for talking about intensity.
Watch these →Where the animations are posted
Animations are published by event, on each earthquake's own page and in the full collection. Every one is also posted to our YouTube channel, one playlist per earthquake — subscribe there to be notified when a new video goes up. This section repeats the links at the top of the page for anyone who has read straight through.
An animation illustrates one ground motion at one site. It is not a prediction of damage to any particular building. Read the disclaimer →