Max Est. MMI
24 km W of Petrolia, CA
Ground Shaking Intensities — Interpolated ShakeMap MMI
3 sites| Location | MMI Description |
|---|---|
|
Ferndale
CA |
Not felt(I) |
|
Rio Dell
CA |
Not felt(I) |
|
Fortuna
CA |
Not felt(I) |
Seismic Station Observed MMI
MMI values are derived directly from observed ground motion measurements at seismic stations and are not spatially interpolated.
| Station | MMI Description |
|---|---|
| Punta Gorda, Petrolia, CA (BK.PETL) | Weak(II) |
| Walker Ranch; near Petrolia CA (BK.WLKR) | Not felt(I) |
| Cooskie Peak (NC.KCO) | Weak(II) |
Engineering Ground Motion Parameters
GMPE predictions provide an independent check on the ShakeMap interpolated intensities above.
ShakeMap relies on seismic station recordings; in areas with sparse station coverage — or
for large teleseismic events and earthquakes outside dense West Coast networks — ShakeMap
MMI can be inaccurate. A significant difference between ShakeMap and GMPE estimates is a signal
that the ShakeMap result should be treated as preliminary.
Also includes site Vs30 values and raw ground motion parameters (PGA/PGV).
Show ▼
Engineering Ground Motion Parameters
GMPE predictions provide an independent check on the ShakeMap interpolated intensities above. ShakeMap relies on seismic station recordings; in areas with sparse station coverage — or for large teleseismic events and earthquakes outside dense West Coast networks — ShakeMap MMI can be inaccurate. A significant difference between ShakeMap and GMPE estimates is a signal that the ShakeMap result should be treated as preliminary. Also includes site Vs30 values and raw ground motion parameters (PGA/PGV).
Est. Vs30 Values
Estimated shear-wave velocity in the upper 30 m used in GMPE calculations. Ref. column shows the 760 m/s rock-site reference for comparison.
| Location | Ref. (760 m/s) | Est. Vs30 (m/s) |
|---|---|---|
|
Ferndale
CA |
760 | 273 |
|
Rio Dell
CA |
760 | 468 |
|
Fortuna
CA |
760 | 418 |
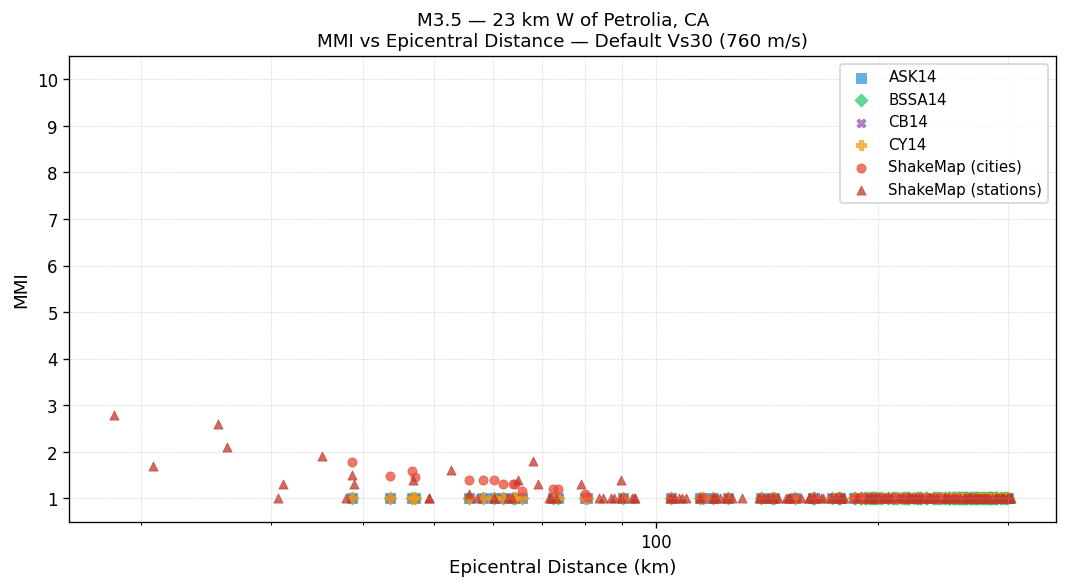
MMI vs Distance — Default Vs30 (760 m/s)
All methods using the 760 m/s rock-site reference. ShakeMap values are independent of Vs30.
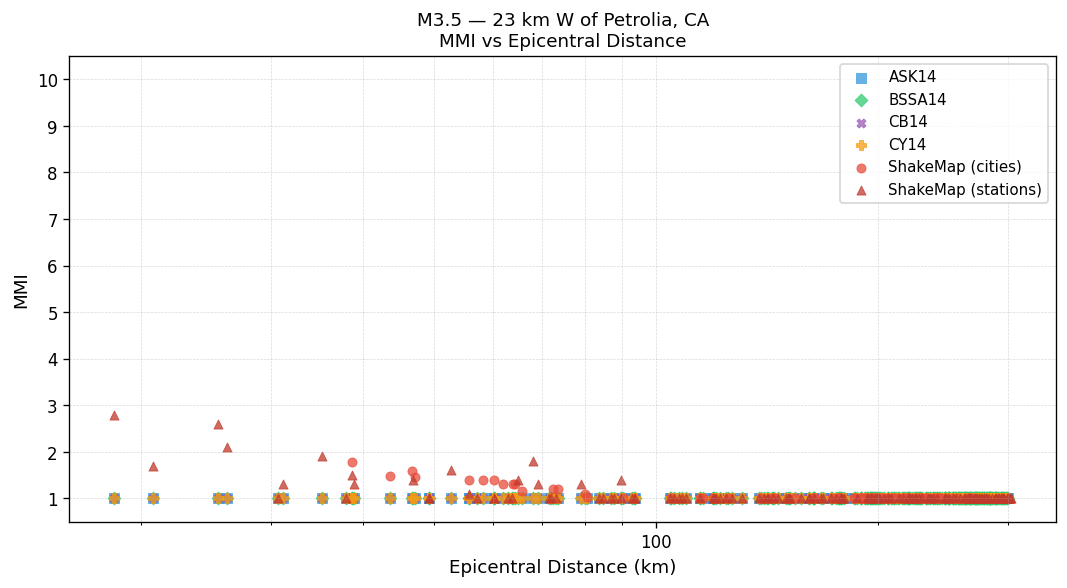
MMI vs Distance — Est. Vs30
GMPEs use the Est. Vs30 values shown in the table above. ShakeMap values are independent of Vs30.
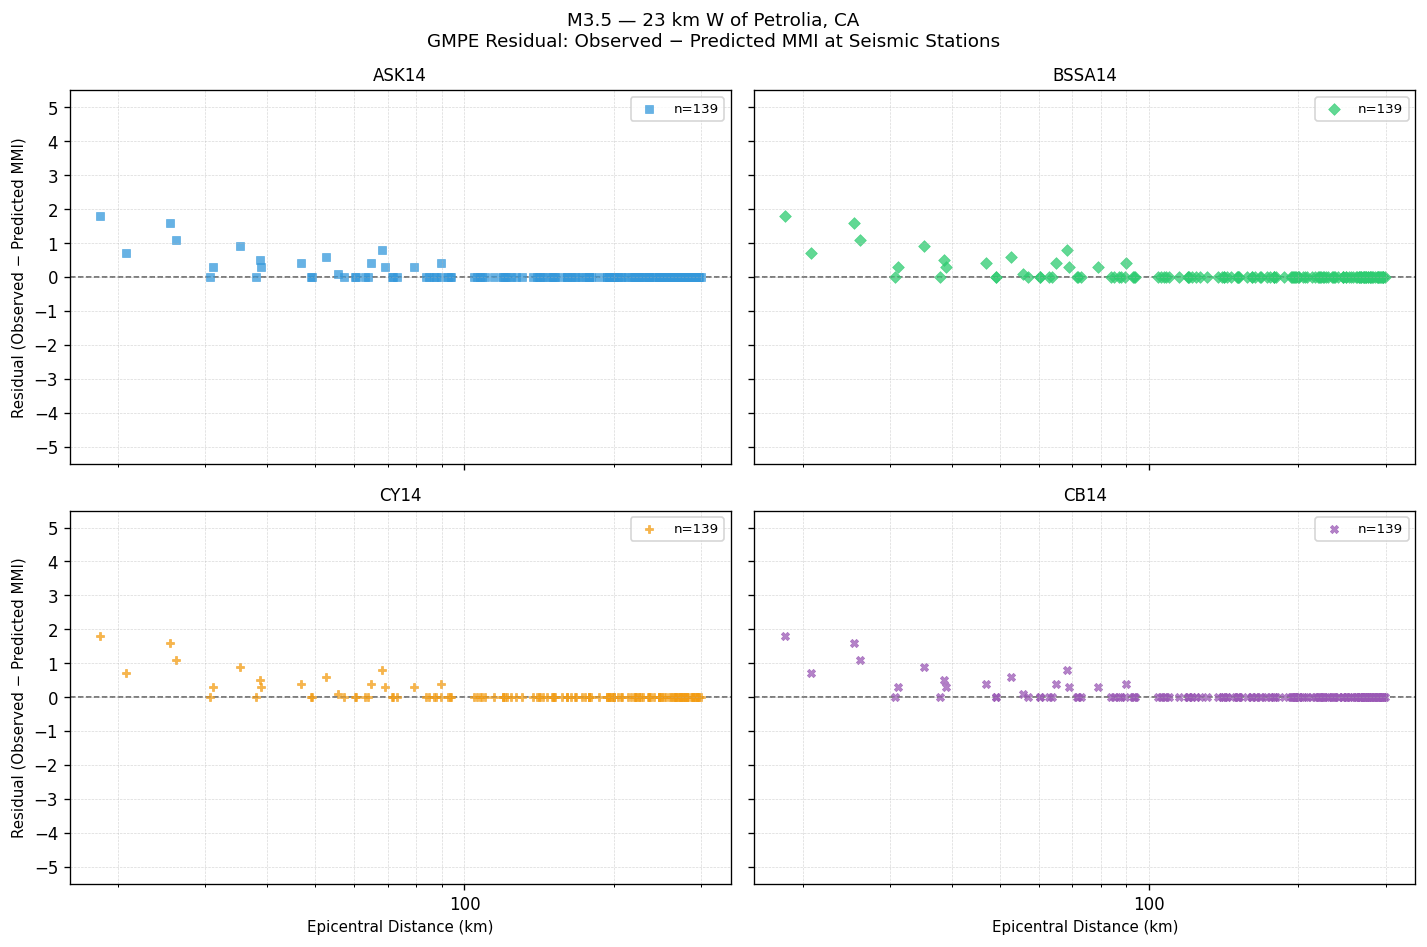
GMPE Residual — Observed − Predicted MMI
Signed residual at each seismic station. Positive values mean the GMPE underestimated shaking; negative values mean it overestimated. The dashed line at zero indicates perfect agreement.
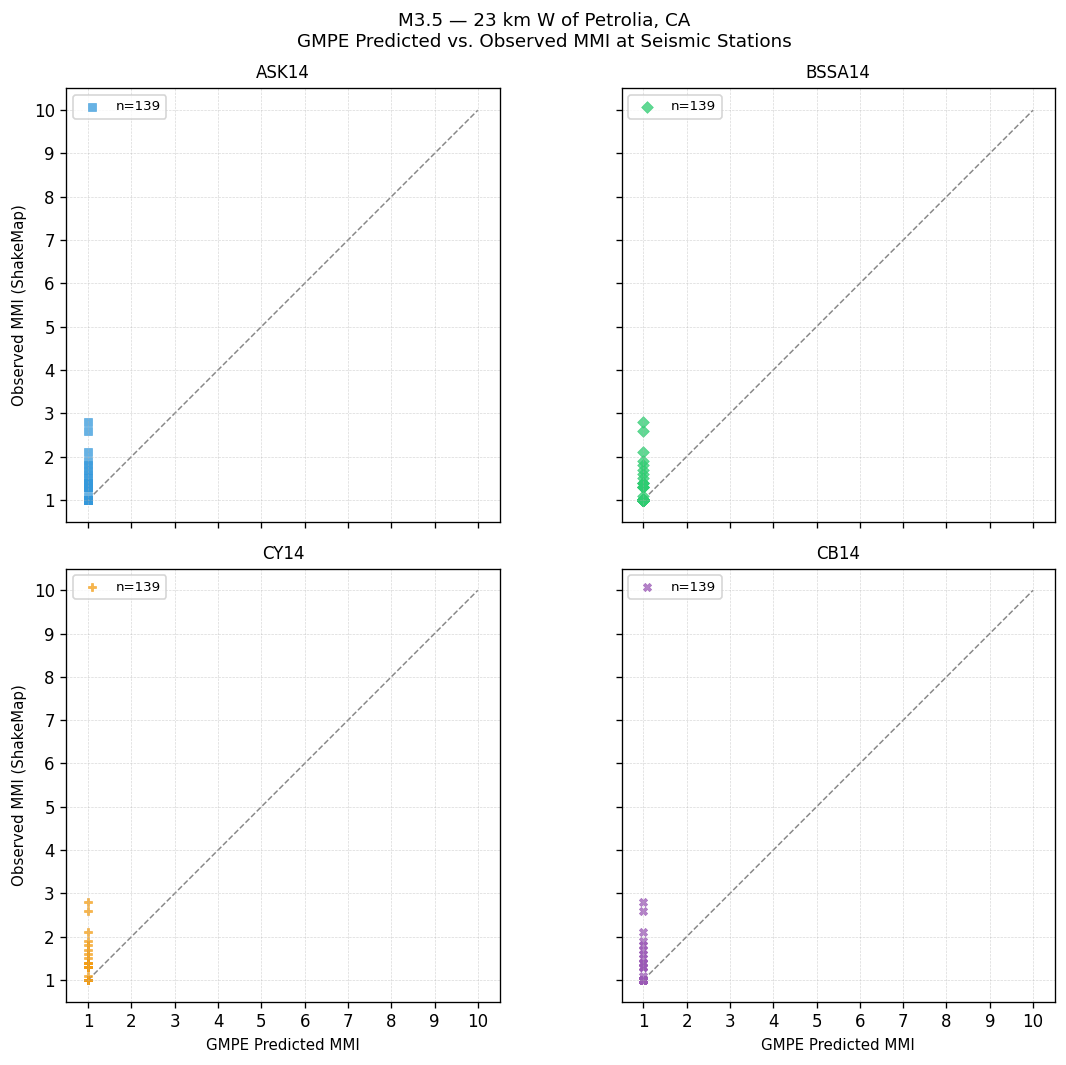
GMPE Predicted vs. Observed MMI at Seismic Stations
Each point is one seismic station. Points on the dashed 1:1 line indicate perfect agreement; above the line = GMPE underestimated shaking; below = overestimated.
GMPE Performance — Station Observations
Statistics computed by comparing each GMPE's predicted MMI against ShakeMap observed MMI at seismic stations. Bias = mean(observed − predicted). Lower RMSE indicates better overall agreement with instrumental measurements.
| GMPE | Bias | Sigma | RMSE |
|---|---|---|---|
| ASK14 | +0.08 | 0.26 | 0.27 |
| BSSA14 | +0.08 | 0.26 | 0.27 |
| CY14 | +0.08 | 0.26 | 0.27 |
| CB14 | +0.08 | 0.26 | 0.27 |
Peak Ground Motion — Seismic Station Observations
Recorded PGA and PGV at seismic stations, sorted by highest PGA. Top 25 stations shown. MMI (PGA) and MMI (PGV) are independent conversions via Worden et al. (2012) GMICE.
| Station | PGA (g) | MMI (PGA) | PGV (cm/s) | MMI (PGV) |
|---|---|---|---|---|
| Punta Gorda, Petrolia, CA (BK.PETL) | 0.0029 | Not felt(I) | 0.148 | Weak(II) |
| Cooskie Peak (NC.KCO) | 0.0020 | Not felt(I) | 0.102 | Weak(II) |
| Slide Mountain (NC.KSM) | 0.0008 | Not felt(I) | 0.044 | Not felt(I) |
| Fire Station (NP.1023) | 0.0006 | Not felt(I) | 0.029 | Not felt(I) |
| Needle Rock (NC.KNR) | 0.0006 | Not felt(I) | 0.026 | Not felt(I) |
| Loleta Fire Station (NP.1586) | 0.0006 | Not felt(I) | 0.026 | Not felt(I) |
| Usal Creek (BK.USAL) | 0.0006 | Not felt(I) | 0.023 | Not felt(I) |
| Sproul Creek (BK.SPRL) | 0.0005 | Not felt(I) | 0.037 | Not felt(I) |
| Thorn Junction (NC.KTJ) | 0.0005 | Not felt(I) | 0.012 | Not felt(I) |
| Cape Town (NC.KCT) | 0.0005 | Not felt(I) | 0.053 | Not felt(I) |
| Hales Grove, Mendocino, CA (BK.HALS) | 0.0005 | Not felt(I) | 0.025 | Not felt(I) |
| Lost Coast Ranch (NP.1725) | 0.0004 | Not felt(I) | 0.023 | Not felt(I) |
| College of the Redwoods (NP.1582) | 0.0004 | Not felt(I) | 0.031 | Not felt(I) |
| Walker Ranch; near Petrolia CA (BK.WLKR) | 0.0004 | Not felt(I) | 0.033 | Not felt(I) |
| Bunker Hill, NOAA Radar (NP.1584B) | 0.0004 | Not felt(I) | 0.015 | Not felt(I) |
| Mount Pierce (NC.KMPB) | 0.0004 | Not felt(I) | 0.023 | Not felt(I) |
| Garberville CALFire station (NP.1591) | 0.0004 | Not felt(I) | 0.022 | Not felt(I) |
| Paradise Ridge (BK.PRDS) | 0.0003 | Not felt(I) | 0.014 | Not felt(I) |
| Briceland Vineyard, Redway, CA (BK.BRIC) | 0.0003 | Not felt(I) | 0.015 | Not felt(I) |
| South Bay School (NP.1581) | 0.0003 | Not felt(I) | 0.019 | Not felt(I) |
| Jewett Creek (BK.JEWT) | 0.0002 | Not felt(I) | 0.015 | Not felt(I) |
| Rainbow Ridge, Humboldt, CA (BK.RBOW) | 0.0002 | Not felt(I) | 0.011 | Not felt(I) |
| Bald Jesse, Humboldt County, CA (BK.BJES) | 0.0002 | Not felt(I) | 0.016 | Not felt(I) |
| Healdsburg Fire Station (NP.1744) | 0.0001 | Not felt(I) | 0.003 | Not felt(I) |
| Boyer?s Landing, near Robbins (BK.BOYR) | 0.0001 | Not felt(I) | 0.002 | Not felt(I) |