Max Est. MMI
2 km SW of Alamo, CA
Ground Shaking Intensities — Interpolated ShakeMap MMI
3 sites| Location | MMI Description |
|---|---|
|
Alamo
CA |
Weak(II) |
|
Danville
CA |
Weak(II) |
|
Saranap
CA |
Weak(II) |
Seismic Station Observed MMI
MMI values are derived directly from observed ground motion measurements at seismic stations and are not spatially interpolated.
| Station | MMI Description |
|---|---|
| Bollinger Canyon Rd (NC.CBR) | Weak(II) |
| Round Hill Res (NC.CRH) | Weak(III) |
| CA:Danville;FS 31 (NP.1690) | Weak(II) |
Engineering Ground Motion Parameters
GMPE predictions provide an independent check on the ShakeMap interpolated intensities above.
ShakeMap relies on seismic station recordings; in areas with sparse station coverage — or
for large teleseismic events and earthquakes outside dense West Coast networks — ShakeMap
MMI can be inaccurate. A significant difference between ShakeMap and GMPE estimates is a signal
that the ShakeMap result should be treated as preliminary.
Also includes site Vs30 values and raw ground motion parameters (PGA/PGV).
Show ▼
Engineering Ground Motion Parameters
GMPE predictions provide an independent check on the ShakeMap interpolated intensities above. ShakeMap relies on seismic station recordings; in areas with sparse station coverage — or for large teleseismic events and earthquakes outside dense West Coast networks — ShakeMap MMI can be inaccurate. A significant difference between ShakeMap and GMPE estimates is a signal that the ShakeMap result should be treated as preliminary. Also includes site Vs30 values and raw ground motion parameters (PGA/PGV).
Est. Vs30 Values
Estimated shear-wave velocity in the upper 30 m used in GMPE calculations. Ref. column shows the 760 m/s rock-site reference for comparison.
| Location | Ref. (760 m/s) | Est. Vs30 (m/s) |
|---|---|---|
|
Alamo
CA |
760 | 352 |
|
Danville
CA |
760 | 335 |
|
Saranap
CA |
760 | 352 |
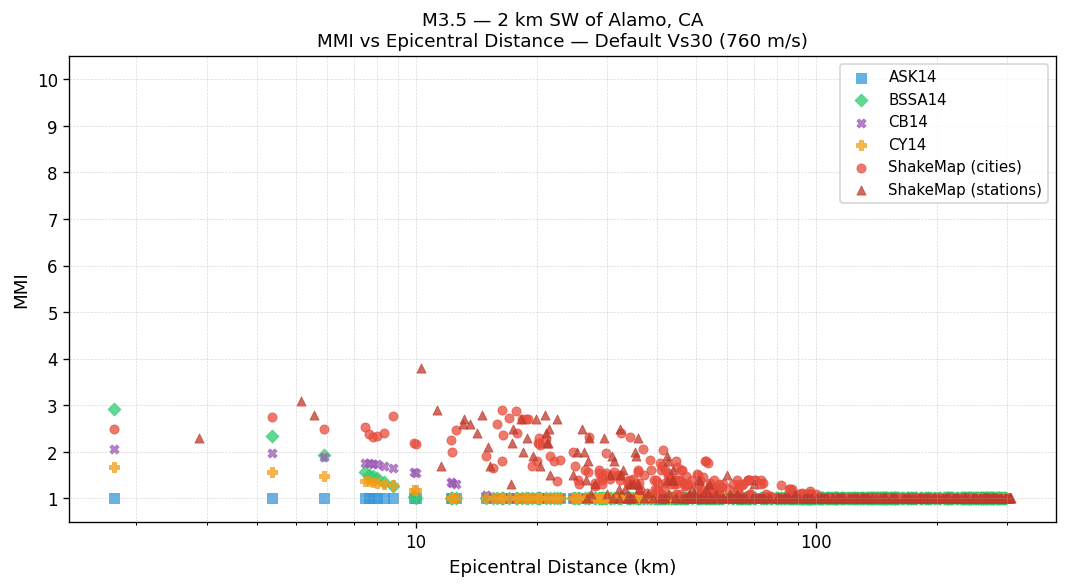
MMI vs Distance — Default Vs30 (760 m/s)
All methods using the 760 m/s rock-site reference. ShakeMap values are independent of Vs30.
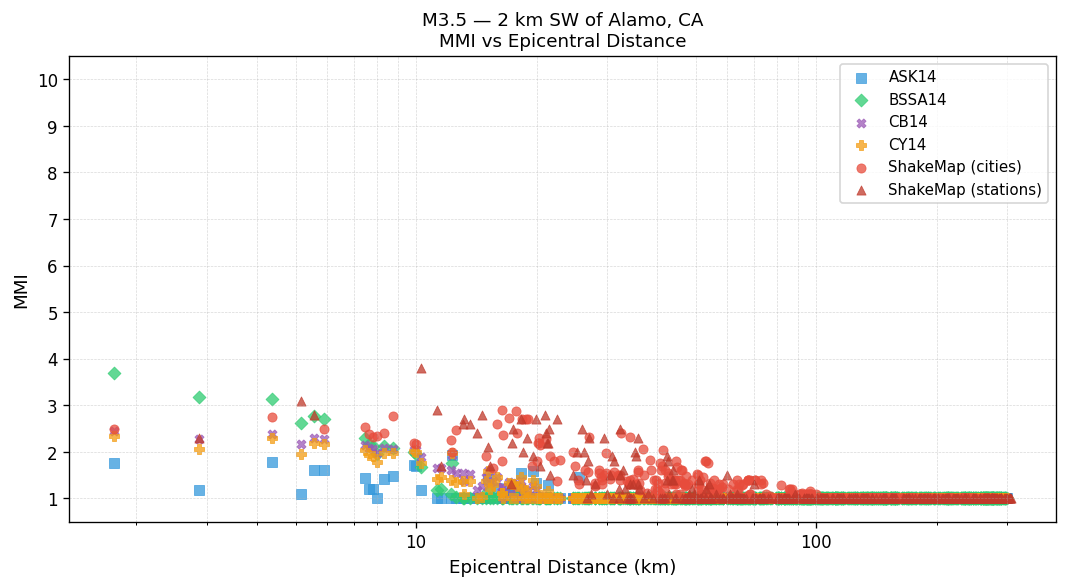
MMI vs Distance — Est. Vs30
GMPEs use the Est. Vs30 values shown in the table above. ShakeMap values are independent of Vs30.
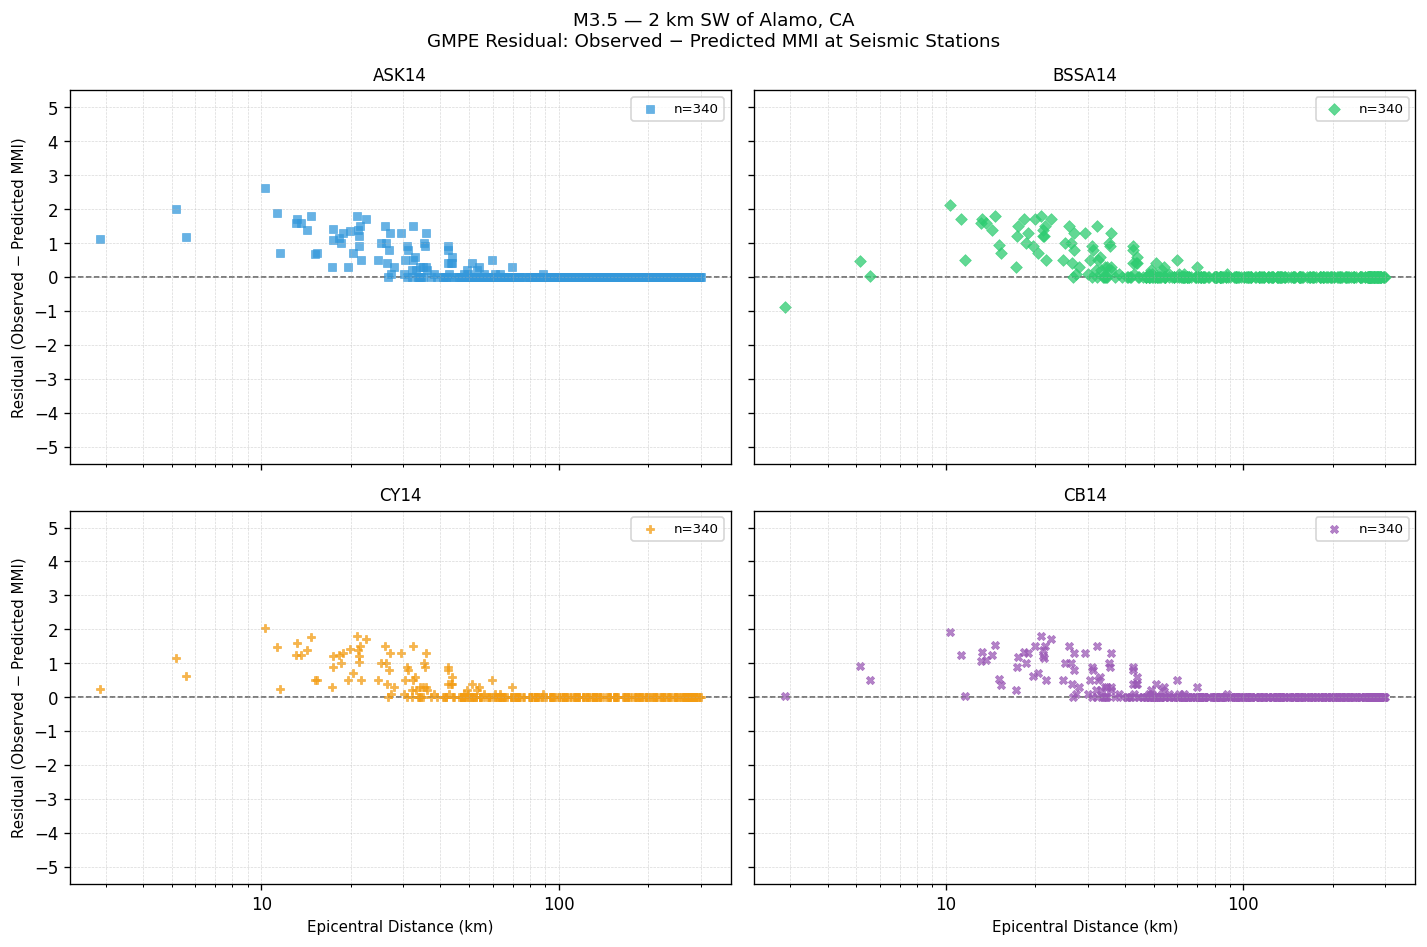
GMPE Residual — Observed − Predicted MMI
Signed residual at each seismic station. Positive values mean the GMPE underestimated shaking; negative values mean it overestimated. The dashed line at zero indicates perfect agreement.
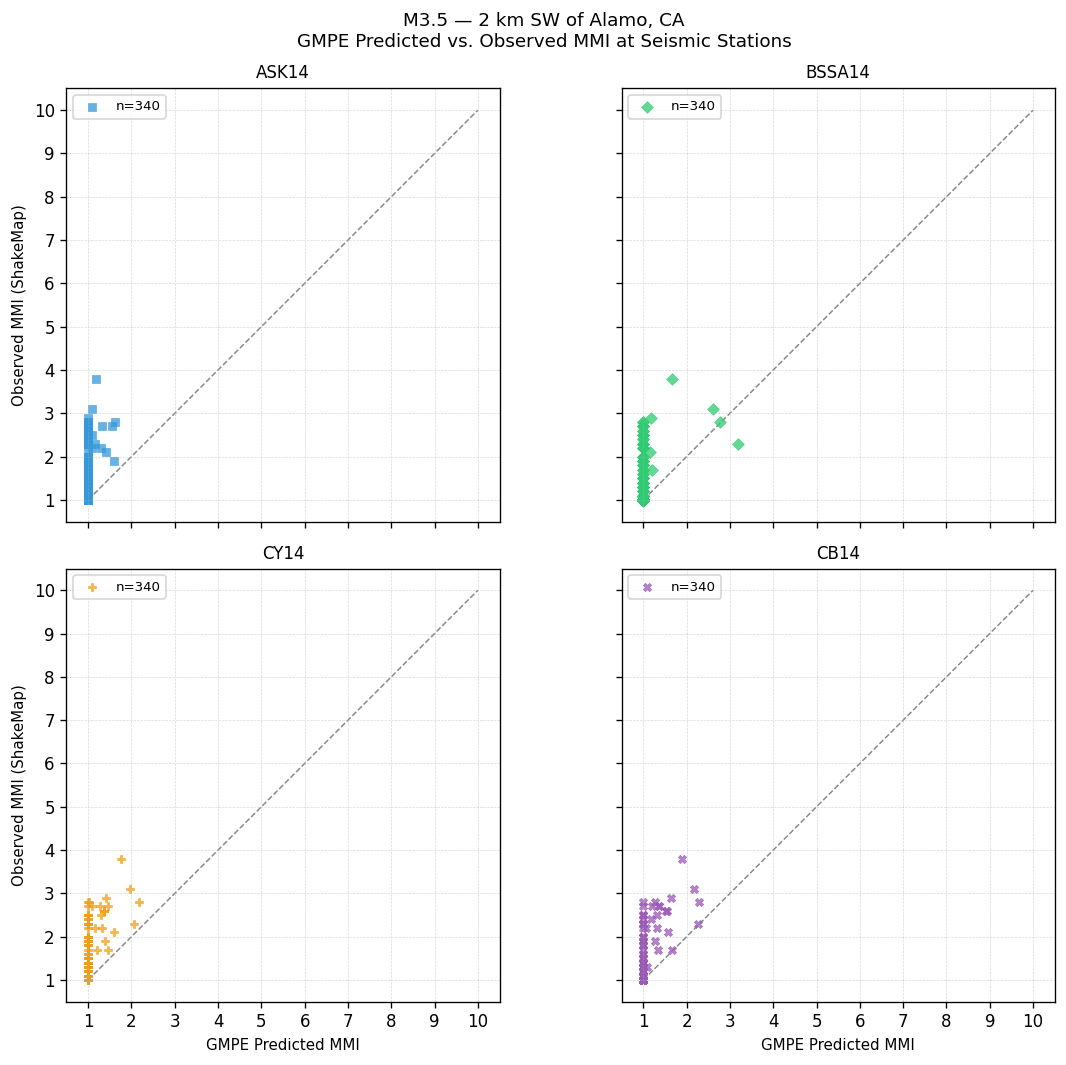
GMPE Predicted vs. Observed MMI at Seismic Stations
Each point is one seismic station. Points on the dashed 1:1 line indicate perfect agreement; above the line = GMPE underestimated shaking; below = overestimated.
GMPE Performance — Station Observations
Statistics computed by comparing each GMPE's predicted MMI against ShakeMap observed MMI at seismic stations. Bias = mean(observed − predicted). Lower RMSE indicates better overall agreement with instrumental measurements.
| GMPE | Bias | Sigma | RMSE |
|---|---|---|---|
| ASK14 | +0.18 | 0.43 | 0.47 |
| BSSA14 | +0.17 | 0.42 | 0.46 |
| CY14 | +0.16 | 0.40 | 0.43 |
| CB14 | +0.16 | 0.38 | 0.41 |
Peak Ground Motion — Seismic Station Observations
Recorded PGA and PGV at seismic stations, sorted by highest PGA. Top 25 stations shown. MMI (PGA) and MMI (PGV) are independent conversions via Worden et al. (2012) GMICE.
| Station | PGA (g) | MMI (PGA) | PGV (cm/s) | MMI (PGV) |
|---|---|---|---|---|
| Fire Station 2 (NP.1691) | 0.0192 | Weak(III) | 0.627 | Weak(III) |
| Lake Chabot (NC.CLCB) | 0.0055 | Not felt(I) | 0.164 | Weak(II) |
| Round Hill Res (NC.CRH) | 0.0051 | Not felt(I) | 0.235 | Weak(II) |
| Russellman Park (NC.CRPB) | 0.0049 | Not felt(I) | 0.140 | Weak(II) |
| Pinole Ridge (NC.CPI) | 0.0044 | Not felt(I) | 0.130 | Weak(II) |
| Summit Reservoir (NC.CSUM) | 0.0041 | Not felt(I) | 0.058 | Weak(II) |
| Martinez Fire Station 14 (NP.1847B) | 0.0036 | Not felt(I) | 0.138 | Weak(II) |
| CA:Danville;FS 31 (NP.1690) | 0.0036 | Not felt(I) | 0.134 | Weak(II) |
| Mills College #2 (NC.CMC) | 0.0035 | Not felt(I) | 0.113 | Weak(II) |
| San Pablo Ridge #2 (NC.CSPB) | 0.0032 | Not felt(I) | 0.037 | Not felt(I) |
| Briones Reserve, Orinda, CA, USA (BK.BRIB) | 0.0025 | Not felt(I) | 0.106 | Weak(II) |
| Cal Memorial Stadium, Berkeley, CA, USA (BK.CMSB) | 0.0025 | Not felt(I) | 0.048 | Not felt(I) |
| CA:Benicia;FS 1 (NP.1760) | 0.0025 | Not felt(I) | 0.087 | Weak(II) |
| Morgan Territory (NC.CMOB) | 0.0023 | Not felt(I) | 0.085 | Weak(II) |
| Bollinger Canyon Rd (NC.CBR) | 0.0021 | Not felt(I) | 0.063 | Weak(II) |
| CA:Oakland;FS 23 (NP.1855) | 0.0021 | Not felt(I) | 0.104 | Weak(II) |
| San Leandro Hills (NC.CSL) | 0.0020 | Not felt(I) | 0.070 | Weak(II) |
| Contra Costa FS 11 Clayton (NP.1846) | 0.0019 | Not felt(I) | 0.035 | Not felt(I) |
| Fire Station 13 (NP.1857) | 0.0019 | Not felt(I) | 0.095 | Weak(II) |
| Berkeley Country Club (NP.1737B) | 0.0019 | Not felt(I) | 0.029 | Not felt(I) |
| Daly City FS 3 (NP.1804) | 0.0018 | Not felt(I) | 0.040 | Not felt(I) |
| Grizzly Island (NC.NGI) | 0.0017 | Not felt(I) | 0.095 | Weak(II) |
| CA:Oakland;FD Training Ctr (NP.1861) | 0.0017 | Not felt(I) | 0.121 | Weak(II) |
| Round Valley Regional Preserve (BK.RVRP) | 0.0017 | Not felt(I) | 0.047 | Not felt(I) |
| LBL Building 88, Berkeley, CA, USA (BK.BL88) | 0.0016 | Not felt(I) | 0.069 | Weak(II) |