Max Est. MMI
30 km SSW of Alamo, Nevada
Ground Shaking Intensities — Interpolated ShakeMap MMI
3 sites| Location | MMI Description |
|---|---|
|
Alamo
NV |
Weak(III) |
|
Moapa Town
NV |
Weak(II) |
|
Caliente
NV |
Weak(II) |
Seismic Station Observed MMI
MMI values are derived directly from observed ground motion measurements at seismic stations and are not spatially interpolated.
| Station | MMI Description |
|---|---|
| Pahroc Range, Nevada. (GPS 12/04/2000) w84 (NN.PRN) | Weak(II) |
| Indian Springs High School, NV, CEMP (QN.ISHS) | Not felt(I) |
| Sheep Range, Nevada w84gm (NN.SHP) | Weak(II) |
Engineering Ground Motion Parameters
GMPE predictions provide an independent check on the ShakeMap interpolated intensities above.
ShakeMap relies on seismic station recordings; in areas with sparse station coverage — or
for large teleseismic events and earthquakes outside dense West Coast networks — ShakeMap
MMI can be inaccurate. A significant difference between ShakeMap and GMPE estimates is a signal
that the ShakeMap result should be treated as preliminary.
Also includes site Vs30 values and raw ground motion parameters (PGA/PGV).
Show ▼
Engineering Ground Motion Parameters
GMPE predictions provide an independent check on the ShakeMap interpolated intensities above. ShakeMap relies on seismic station recordings; in areas with sparse station coverage — or for large teleseismic events and earthquakes outside dense West Coast networks — ShakeMap MMI can be inaccurate. A significant difference between ShakeMap and GMPE estimates is a signal that the ShakeMap result should be treated as preliminary. Also includes site Vs30 values and raw ground motion parameters (PGA/PGV).
Est. Vs30 Values
Estimated shear-wave velocity in the upper 30 m used in GMPE calculations. Ref. column shows the 760 m/s rock-site reference for comparison.
| Location | Ref. (760 m/s) | Est. Vs30 (m/s) |
|---|---|---|
|
Alamo
NV |
760 | 296 |
|
Moapa Town
NV |
760 | 374 |
|
Caliente
NV |
760 | 560 |
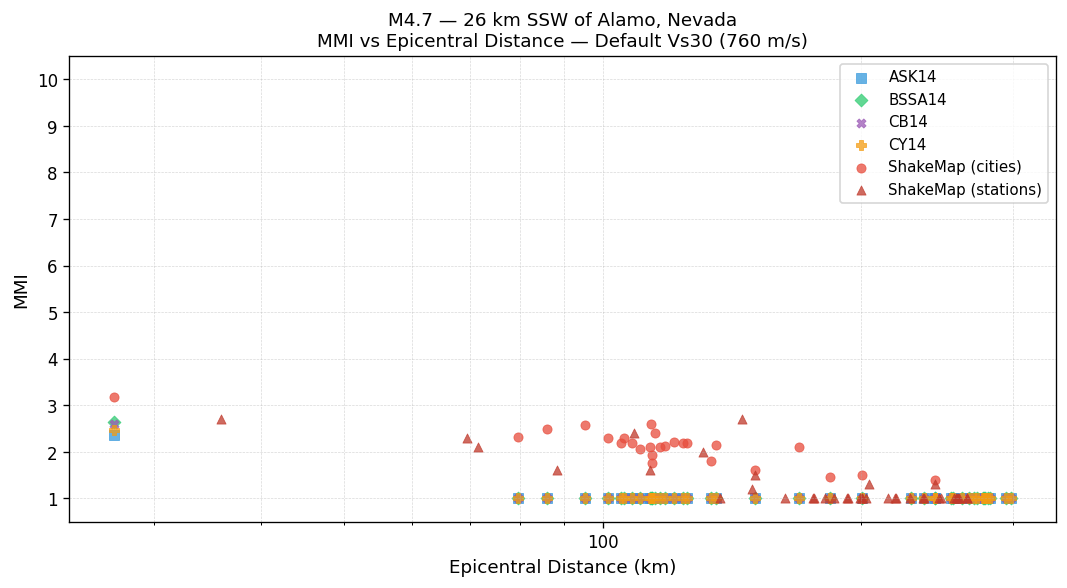
MMI vs Distance — Default Vs30 (760 m/s)
All methods using the 760 m/s rock-site reference. ShakeMap values are independent of Vs30.
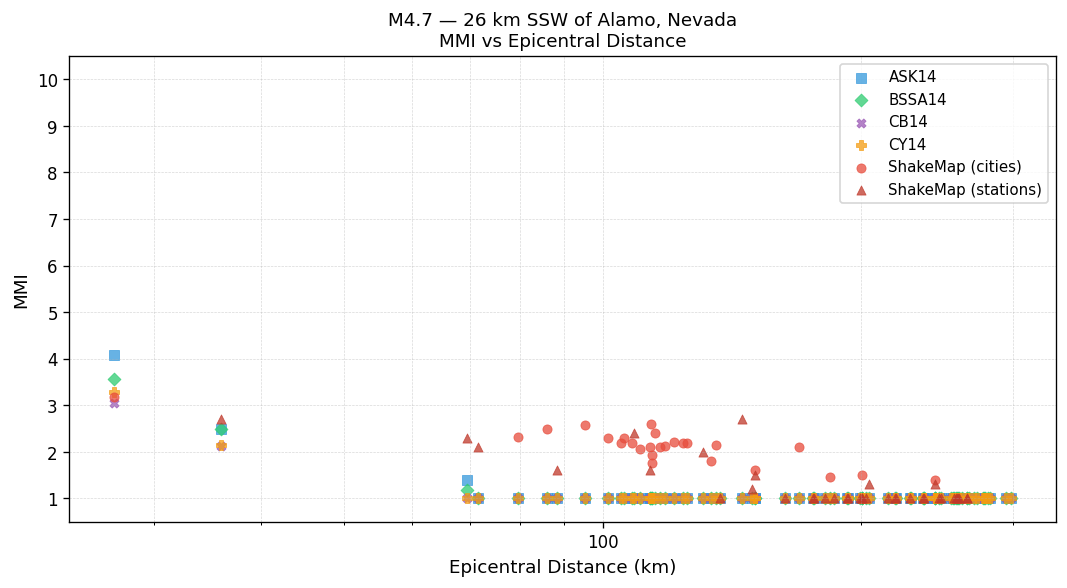
MMI vs Distance — Est. Vs30
GMPEs use the Est. Vs30 values shown in the table above. ShakeMap values are independent of Vs30.
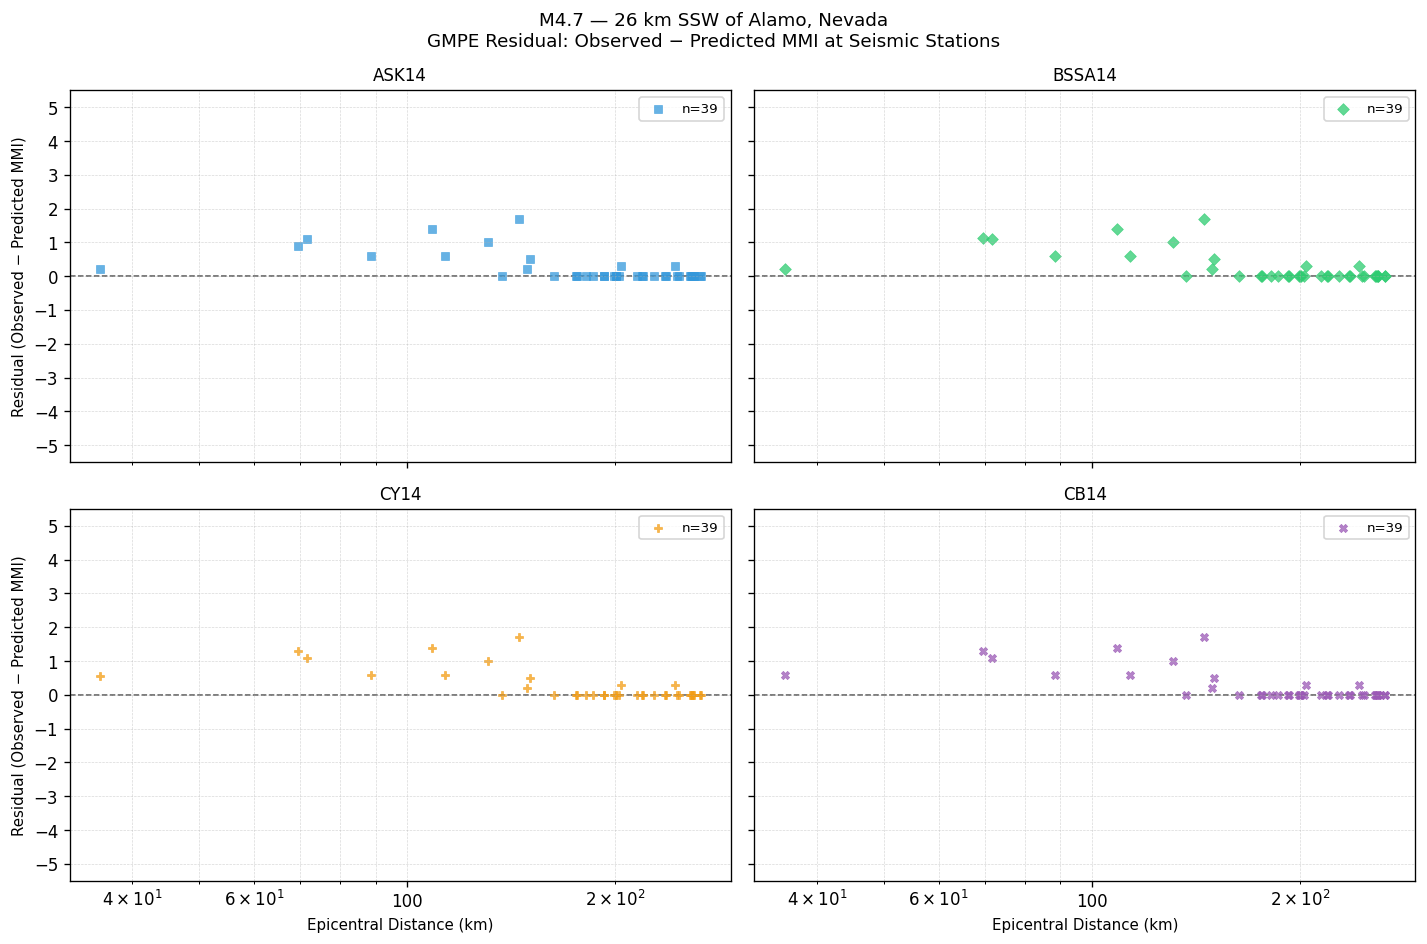
GMPE Residual — Observed − Predicted MMI
Signed residual at each seismic station. Positive values mean the GMPE underestimated shaking; negative values mean it overestimated. The dashed line at zero indicates perfect agreement.
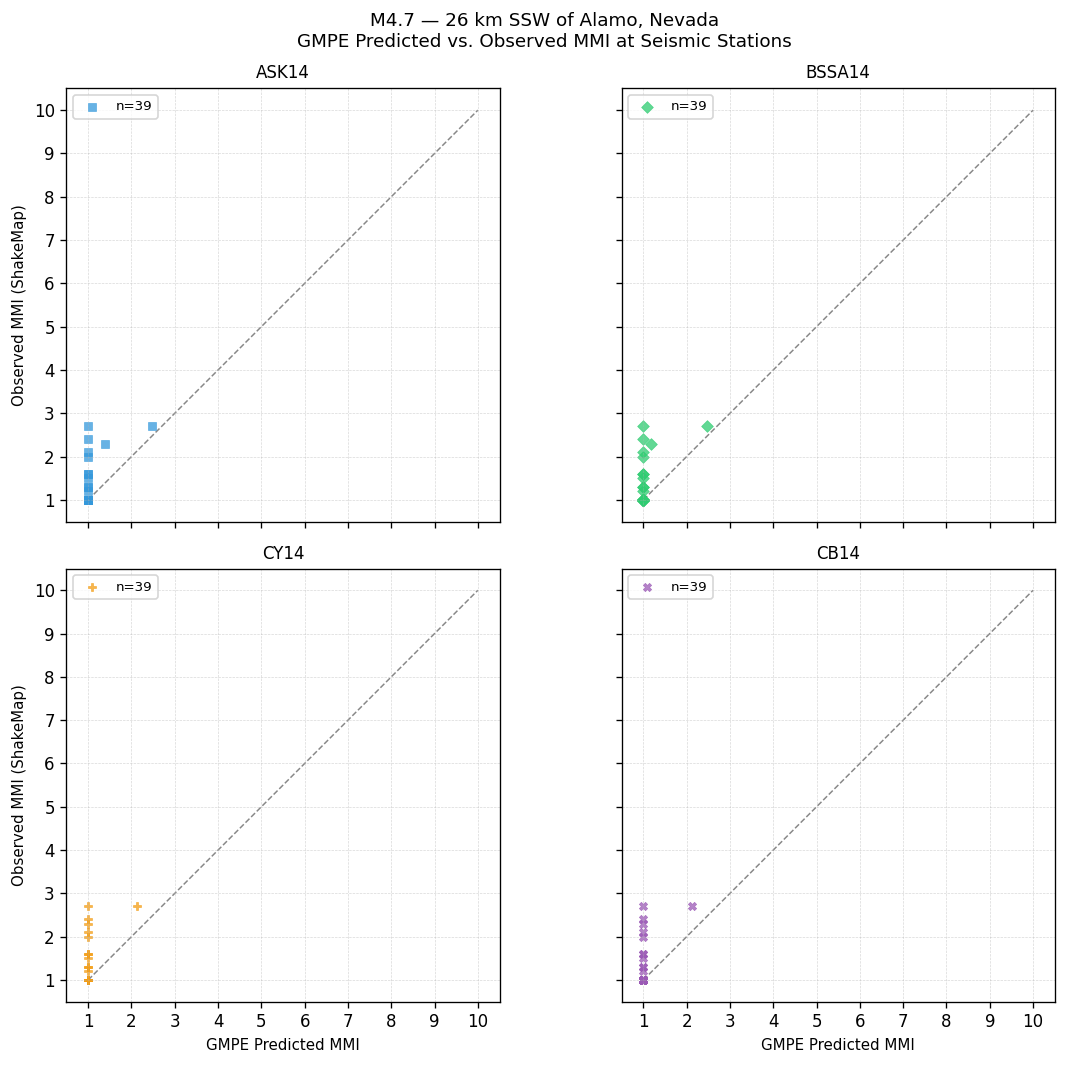
GMPE Predicted vs. Observed MMI at Seismic Stations
Each point is one seismic station. Points on the dashed 1:1 line indicate perfect agreement; above the line = GMPE underestimated shaking; below = overestimated.
GMPE Performance — Station Observations
Statistics computed by comparing each GMPE's predicted MMI against ShakeMap observed MMI at seismic stations. Bias = mean(observed − predicted). Lower RMSE indicates better overall agreement with instrumental measurements.
| GMPE | Bias | Sigma | RMSE |
|---|---|---|---|
| ASK14 | +0.35 | 0.54 | 0.64 |
| BSSA14 | +0.35 | 0.53 | 0.63 |
| CY14 | +0.35 | 0.54 | 0.64 |
| CB14 | +0.35 | 0.54 | 0.64 |
Peak Ground Motion — Seismic Station Observations
Recorded PGA and PGV at seismic stations, sorted by highest PGA. Top 25 stations shown. MMI (PGA) and MMI (PGV) are independent conversions via Worden et al. (2012) GMICE.
| Station | PGA (g) | MMI (PGA) | PGV (cm/s) | MMI (PGV) |
|---|---|---|---|---|
| Hell's Gate, California w84 (SN.HEL) | 0.0043 | Not felt(I) | 0.306 | Weak(III) |
| Pahroc Range, Nevada. (GPS 12/04/2000) w84 (NN.PRN) | 0.0034 | Not felt(I) | 0.174 | Weak(II) |
| Santa Clara, Utah (UU.SCUT) | 0.0020 | Not felt(I) | 0.157 | Weak(II) |
| Hyde High School, LLNL/ANSS BB+SM w84 (NN.HYDE) | 0.0020 | Not felt(I) | 0.170 | Weak(II) |
| 7433 Soaring Heights Ave, Las Vegas (NN.WTNK) | 0.0018 | Not felt(I) | 0.061 | Weak(II) |
| Las Vegas Fire Station (NN.LV04) | 0.0016 | Not felt(I) | 0.131 | Weak(II) |
| Rachel, NV, USA (NN.S11A) | 0.0015 | Not felt(I) | 0.092 | Weak(II) |
| Sheep Range, Nevada w84gm (NN.SHP) | 0.0013 | Not felt(I) | — | — |
| Veyo Road, UT (UU.VRUT) | 0.0011 | Not felt(I) | 0.058 | Weak(II) |
| Indian Springs High School, NV, CEMP (QN.ISHS) | 0.0010 | Not felt(I) | 0.048 | Not felt(I) |
| Clark County Firehouse 12; ANSS SM w84gm (NN.CC12) | 0.0010 | Not felt(I) | 0.108 | Weak(II) |
| Twin Springs Ranch, NV, CEMP (QN.TSRA) | 0.0009 | Not felt(I) | 0.048 | Not felt(I) |
| FORGE 1 (UU.FOR1) | 0.0009 | Not felt(I) | 0.010 | Not felt(I) |
| Iron County Adult Education (UU.IAE) | 0.0008 | Not felt(I) | 0.027 | Not felt(I) |
| Furnace Creek (CI.FUR) | 0.0008 | Not felt(I) | 0.097 | Weak(II) |
| Amargosa Valley Town Office, NV, CEMP (QN.AVTO) | 0.0007 | Not felt(I) | 0.088 | Weak(II) |
| Washington County School District (UU.WDO) | 0.0007 | Not felt(I) | 0.034 | Not felt(I) |
| Henderson FS (NN.HF05) | 0.0007 | Not felt(I) | 0.054 | Not felt(I) |
| Pioche, NV, USA (NN.PIO) | 0.0007 | Not felt(I) | 0.039 | Not felt(I) |
| Pony Springs, Pioche, NV, USA (NN.R12A) | 0.0007 | Not felt(I) | 0.030 | Not felt(I) |
| Las Vegas Fire Station (NN.LV09) | 0.0006 | Not felt(I) | 0.059 | Weak(II) |
| Vocational High School w84gm (NN.VOTK) | 0.0006 | Not felt(I) | 0.048 | Not felt(I) |
| Topopah Spring, Nevada, USA (US.TPNV) | 0.0006 | Not felt(I) | 0.039 | Not felt(I) |
| Grapevine Ranger Station (CI.GRA) | 0.0006 | Not felt(I) | 0.046 | Not felt(I) |
| Sarcobatus Flats, NV, CEMP (QN.SCFL) | 0.0005 | Not felt(I) | 0.049 | Not felt(I) |