Max Est. MMI
2 km ENE of Ridgemark, CA
Ground Shaking Intensities — Interpolated ShakeMap MMI
3 sites| Location | MMI Description |
|---|---|
|
Ridgemark
CA |
Weak(III) |
|
Hollister
CA |
Weak(II) |
|
San Juan Bautista
CA |
Weak(II) |
Seismic Station Observed MMI
MMI values are derived directly from observed ground motion measurements at seismic stations and are not spatially interpolated.
| Station | MMI Description |
|---|---|
| Hollister (CE.47524) | Weak(III) |
| San Benito Historical Park (NC.HHP) | Weak(III) |
| Lone Tree (NC.HLO) | Weak(III) |
Engineering Ground Motion Parameters
GMPE predictions provide an independent check on the ShakeMap interpolated intensities above.
ShakeMap relies on seismic station recordings; in areas with sparse station coverage — or
for large teleseismic events and earthquakes outside dense West Coast networks — ShakeMap
MMI can be inaccurate. A significant difference between ShakeMap and GMPE estimates is a signal
that the ShakeMap result should be treated as preliminary.
Also includes site Vs30 values and raw ground motion parameters (PGA/PGV).
Show ▼
Engineering Ground Motion Parameters
GMPE predictions provide an independent check on the ShakeMap interpolated intensities above. ShakeMap relies on seismic station recordings; in areas with sparse station coverage — or for large teleseismic events and earthquakes outside dense West Coast networks — ShakeMap MMI can be inaccurate. A significant difference between ShakeMap and GMPE estimates is a signal that the ShakeMap result should be treated as preliminary. Also includes site Vs30 values and raw ground motion parameters (PGA/PGV).
Est. Vs30 Values
Estimated shear-wave velocity in the upper 30 m used in GMPE calculations. Ref. column shows the 760 m/s rock-site reference for comparison.
| Location | Ref. (760 m/s) | Est. Vs30 (m/s) |
|---|---|---|
|
Ridgemark
CA |
760 | 380 |
|
Hollister
CA |
760 | 306 |
|
San Juan Bautista
CA |
760 | 352 |
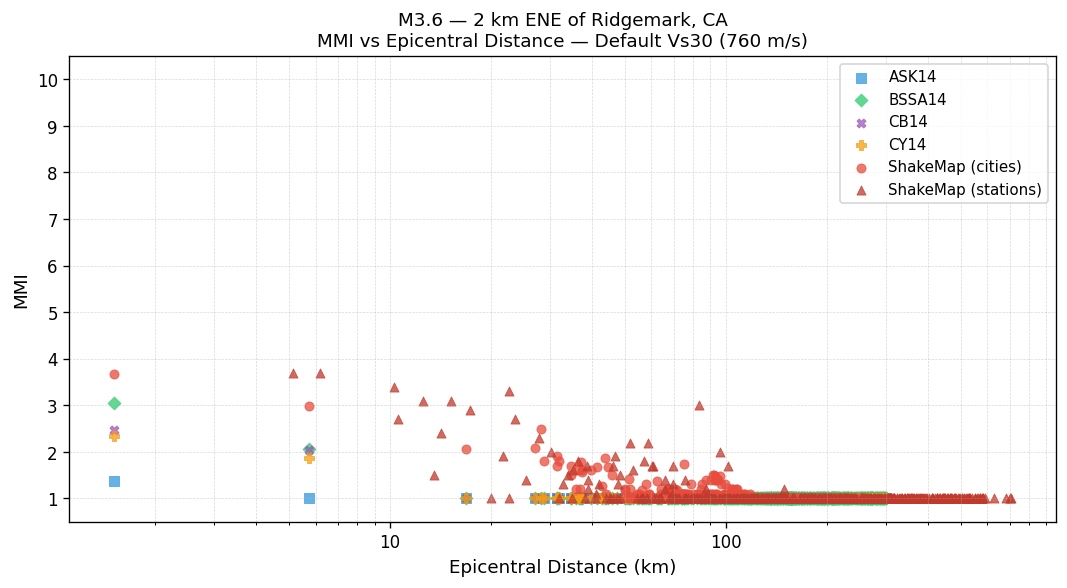
MMI vs Distance — Default Vs30 (760 m/s)
All methods using the 760 m/s rock-site reference. ShakeMap values are independent of Vs30.
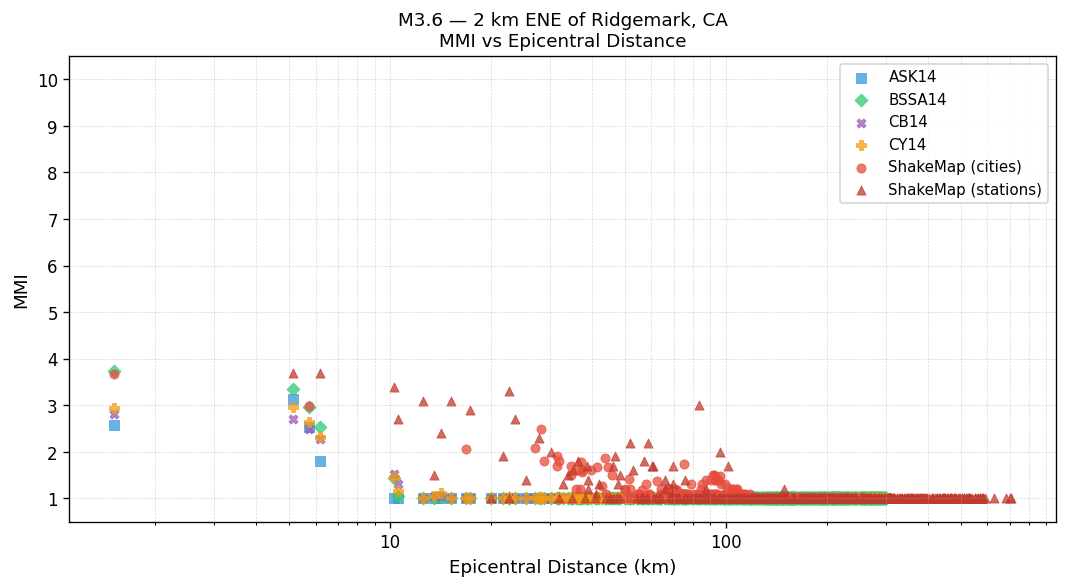
MMI vs Distance — Est. Vs30
GMPEs use the Est. Vs30 values shown in the table above. ShakeMap values are independent of Vs30.
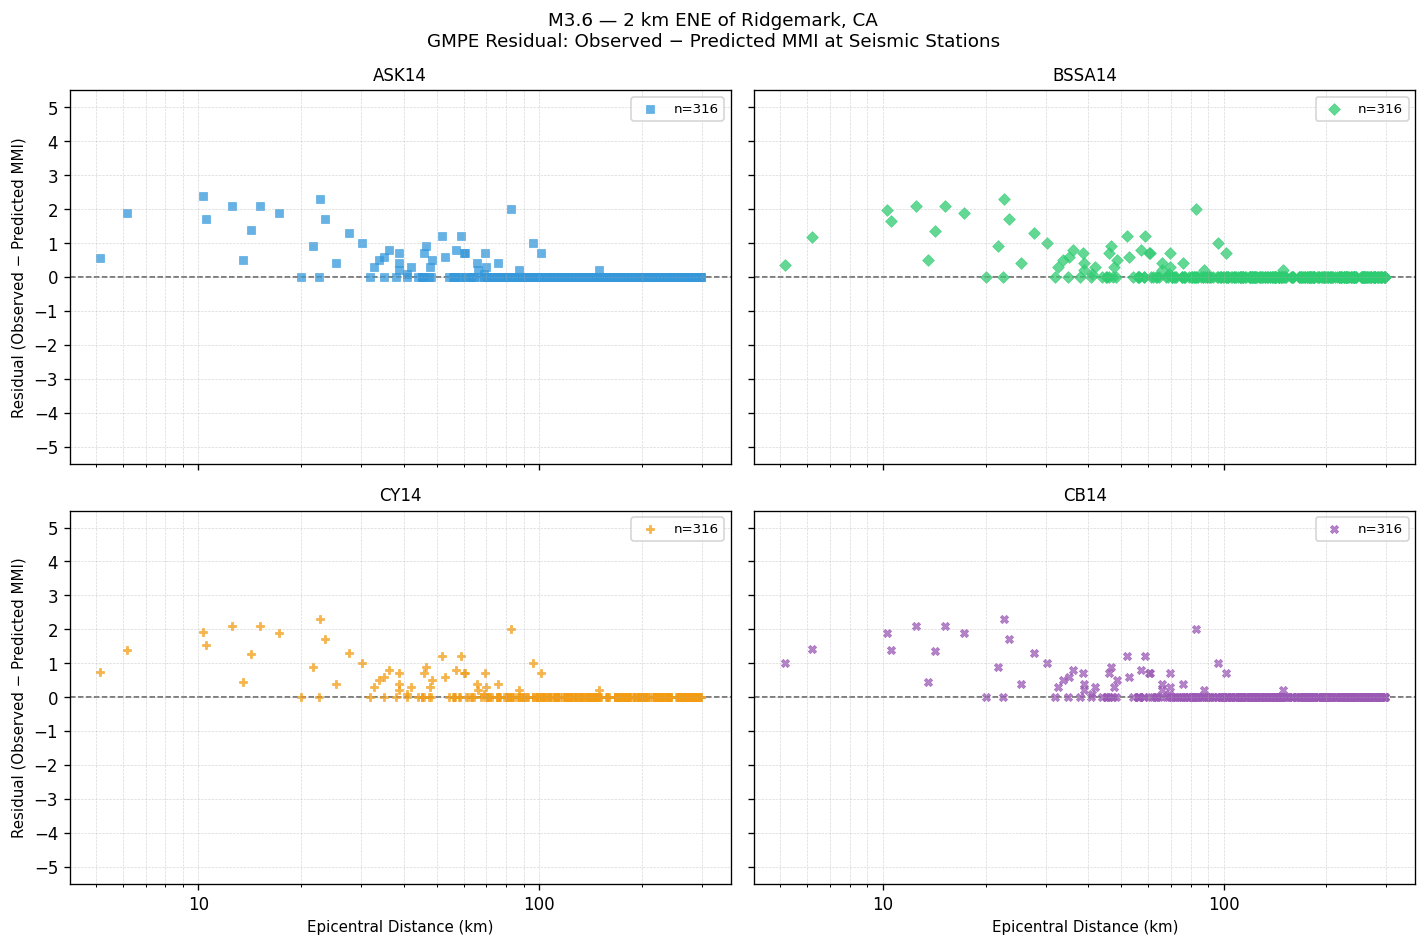
GMPE Residual — Observed − Predicted MMI
Signed residual at each seismic station. Positive values mean the GMPE underestimated shaking; negative values mean it overestimated. The dashed line at zero indicates perfect agreement.
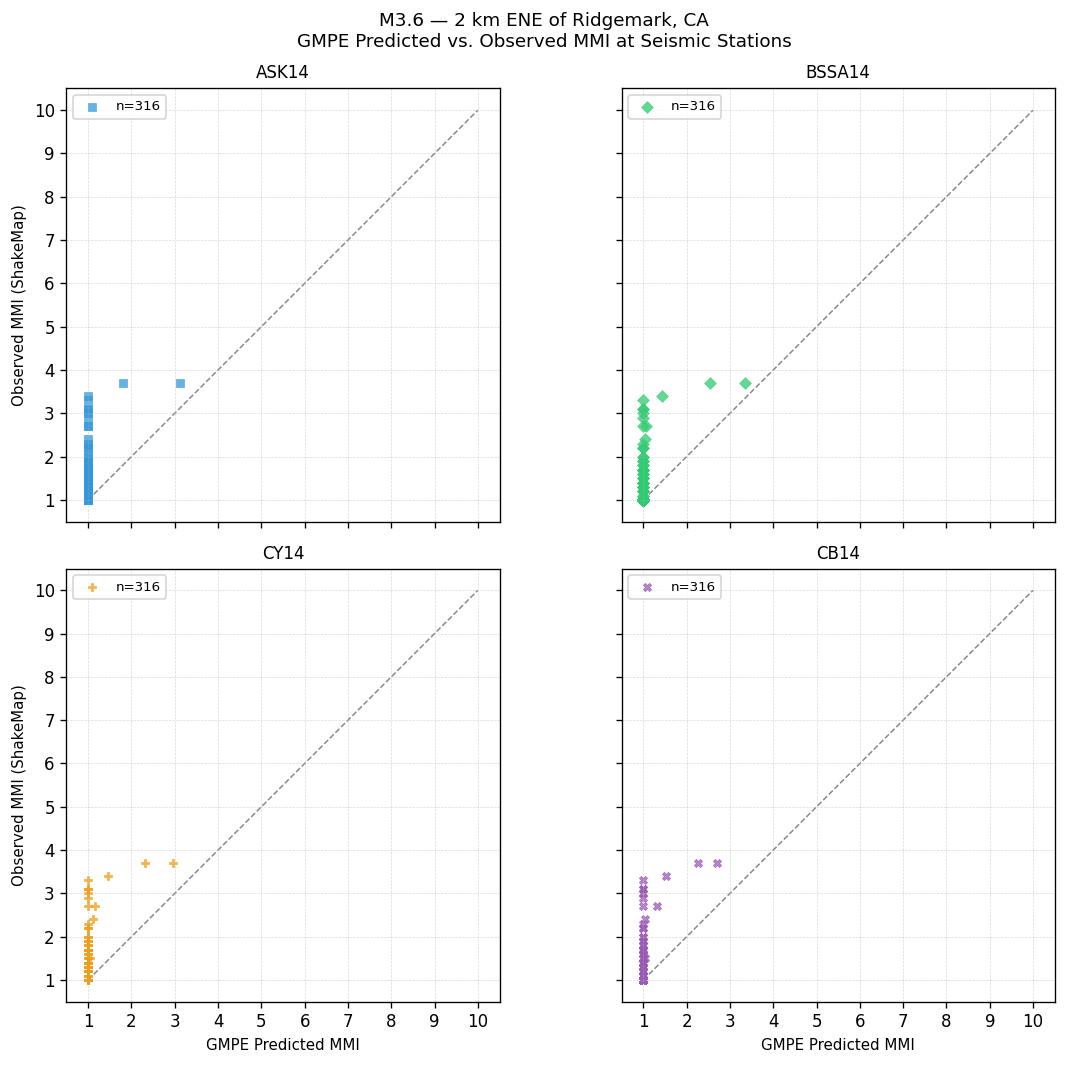
GMPE Predicted vs. Observed MMI at Seismic Stations
Each point is one seismic station. Points on the dashed 1:1 line indicate perfect agreement; above the line = GMPE underestimated shaking; below = overestimated.
GMPE Performance — Station Observations
Statistics computed by comparing each GMPE's predicted MMI against ShakeMap observed MMI at seismic stations. Bias = mean(observed − predicted). Lower RMSE indicates better overall agreement with instrumental measurements.
| GMPE | Bias | Sigma | RMSE |
|---|---|---|---|
| ASK14 | +0.13 | 0.40 | 0.41 |
| BSSA14 | +0.12 | 0.38 | 0.40 |
| CY14 | +0.12 | 0.38 | 0.40 |
| CB14 | +0.12 | 0.38 | 0.40 |
Peak Ground Motion — Seismic Station Observations
Recorded PGA and PGV at seismic stations, sorted by highest PGA. Top 25 stations shown. MMI (PGA) and MMI (PGV) are independent conversions via Worden et al. (2012) GMICE.
| Station | PGA (g) | MMI (PGA) | PGV (cm/s) | MMI (PGV) |
|---|---|---|---|---|
| San Benito Historical Park (NC.HHP) | 0.0426 | Light(IV) | 0.621 | Weak(III) |
| Hollister (CE.47524) | 0.0259 | Weak(III) | 0.628 | Weak(III) |
| Lone Tree (NC.HLO) | 0.0135 | Weak(II) | 0.391 | Weak(III) |
| Cienega Road (NC.BCGB) | 0.0129 | Weak(II) | 0.236 | Weak(II) |
| Strathearn Ranch; UC Natural Reserve (BK.STRA) | 0.0085 | Weak(II) | 0.180 | Weak(II) |
| Salinas Radio Site #2 (NC.BSR) | 0.0082 | Not felt(I) | 0.327 | Weak(III) |
| Mount Johnson (NC.BJOB) | 0.0064 | Not felt(I) | 0.126 | Weak(II) |
| Pinnacle Vineyards (NC.BPV) | 0.0047 | Not felt(I) | 0.221 | Weak(II) |
| San Andreas Geophysical Obs., Hollister, CA, USA (BK.SAO) | 0.0035 | Not felt(I) | 0.124 | Weak(II) |
| Crazy Canyon #3 (NC.PCC) | 0.0032 | Not felt(I) | — | — |
| Shirttail Gulch (NC.BSG) | 0.0022 | Not felt(I) | 0.036 | Not felt(I) |
| Brookhollow Lane (NC.HBH) | 0.0021 | Not felt(I) | 0.077 | Weak(II) |
| Hastings 2 (BK.HAS2) | 0.0019 | Not felt(I) | 0.059 | Weak(II) |
| Panoche Road (NC.BPA) | 0.0018 | Not felt(I) | 0.062 | Weak(II) |
| San Luis Parks and Rec (WR.SPR) | 0.0014 | Not felt(I) | 0.024 | Not felt(I) |
| Lonoak Road 2 (NC.PLOB) | 0.0013 | Not felt(I) | 0.034 | Not felt(I) |
| Juan Fiesta (NC.BJF) | 0.0013 | Not felt(I) | 0.061 | Weak(II) |
| Chase Ranch (NC.HCRB) | 0.0013 | Not felt(I) | 0.025 | Not felt(I) |
| Palo Escrito (NC.BPE) | 0.0012 | Not felt(I) | 0.023 | Not felt(I) |
| Calera Canyon (NC.BCC) | 0.0012 | Not felt(I) | 0.044 | Not felt(I) |
| Big Mountain #3 (NC.BBGB) | 0.0011 | Not felt(I) | 0.035 | Not felt(I) |
| Pacheco Peak, CA, USA (BK.PACP) | 0.0011 | Not felt(I) | 0.041 | Not felt(I) |
| Hahn Winery (NC.BHW) | 0.0011 | Not felt(I) | 0.028 | Not felt(I) |
| Chews Ridge (NC.BCWB) | 0.0011 | Not felt(I) | 0.036 | Not felt(I) |
| St. Francis Retreat (NC.HSFB) | 0.0011 | Not felt(I) | 0.028 | Not felt(I) |