Max Est. MMI
19 km SE of Silver Springs, Nevada
Ground Shaking Intensities — Interpolated ShakeMap MMI
3 sites| Location | MMI Description |
|---|---|
|
Silver Springs
NV |
Light(IV) |
|
Stagecoach
NV |
Weak(III) |
|
Fallon
NV |
Weak(III) |
Seismic Station Observed MMI
MMI values are derived directly from observed ground motion measurements at seismic stations and are not spatially interpolated.
| Station | MMI Description |
|---|---|
| Yerington, Nevada w84gm (NN.YER) | Weak(III) |
| Virginia City, Nevada gps (NN.VCN) | Weak(II) |
| Pah Rah Range, Nevada w84gm (NN.PAH) | Weak(II) |
Engineering Ground Motion Parameters
GMPE predictions provide an independent check on the ShakeMap interpolated intensities above.
ShakeMap relies on seismic station recordings; in areas with sparse station coverage — or
for large teleseismic events and earthquakes outside dense West Coast networks — ShakeMap
MMI can be inaccurate. A significant difference between ShakeMap and GMPE estimates is a signal
that the ShakeMap result should be treated as preliminary.
Also includes site Vs30 values and raw ground motion parameters (PGA/PGV).
Show ▼
Engineering Ground Motion Parameters
GMPE predictions provide an independent check on the ShakeMap interpolated intensities above. ShakeMap relies on seismic station recordings; in areas with sparse station coverage — or for large teleseismic events and earthquakes outside dense West Coast networks — ShakeMap MMI can be inaccurate. A significant difference between ShakeMap and GMPE estimates is a signal that the ShakeMap result should be treated as preliminary. Also includes site Vs30 values and raw ground motion parameters (PGA/PGV).
Est. Vs30 Values
Estimated shear-wave velocity in the upper 30 m used in GMPE calculations. Ref. column shows the 760 m/s rock-site reference for comparison.
| Location | Ref. (760 m/s) | Est. Vs30 (m/s) |
|---|---|---|
|
Silver Springs
NV |
760 | 322 |
|
Stagecoach
NV |
760 | 370 |
|
Fallon
NV |
760 | 201 |
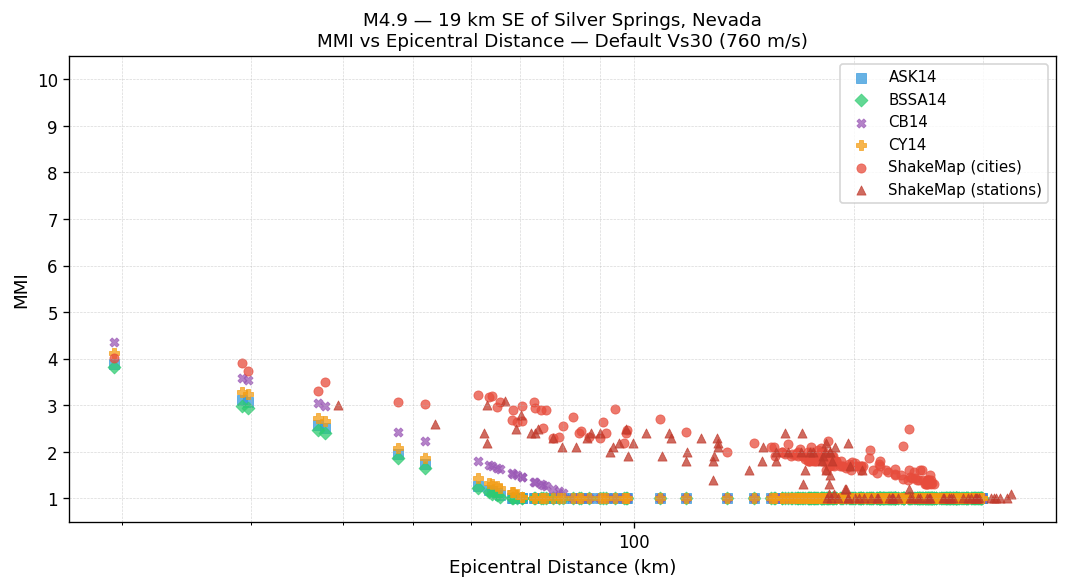
MMI vs Distance — Default Vs30 (760 m/s)
All methods using the 760 m/s rock-site reference. ShakeMap values are independent of Vs30.
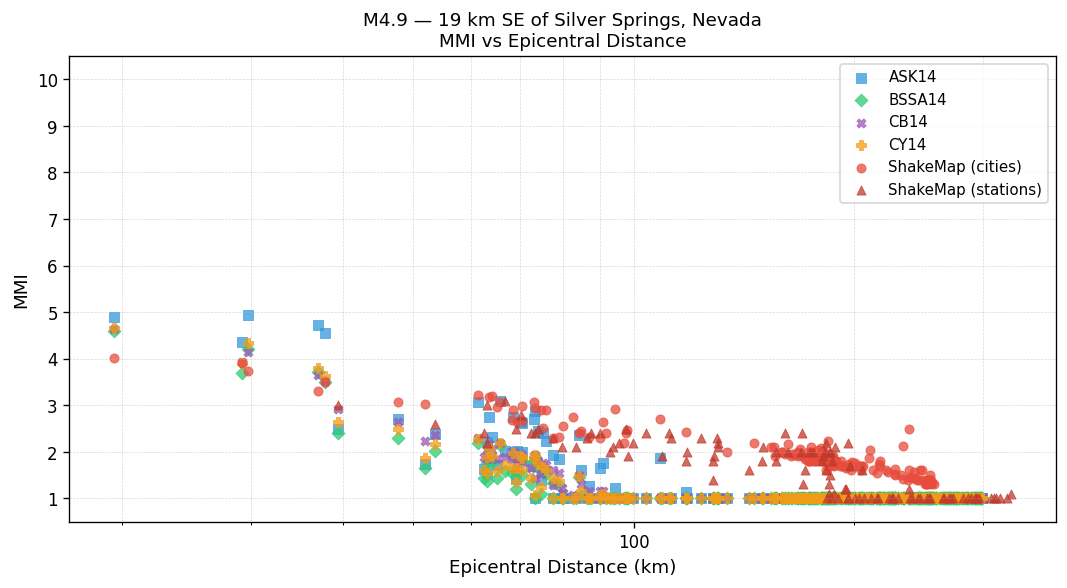
MMI vs Distance — Est. Vs30
GMPEs use the Est. Vs30 values shown in the table above. ShakeMap values are independent of Vs30.
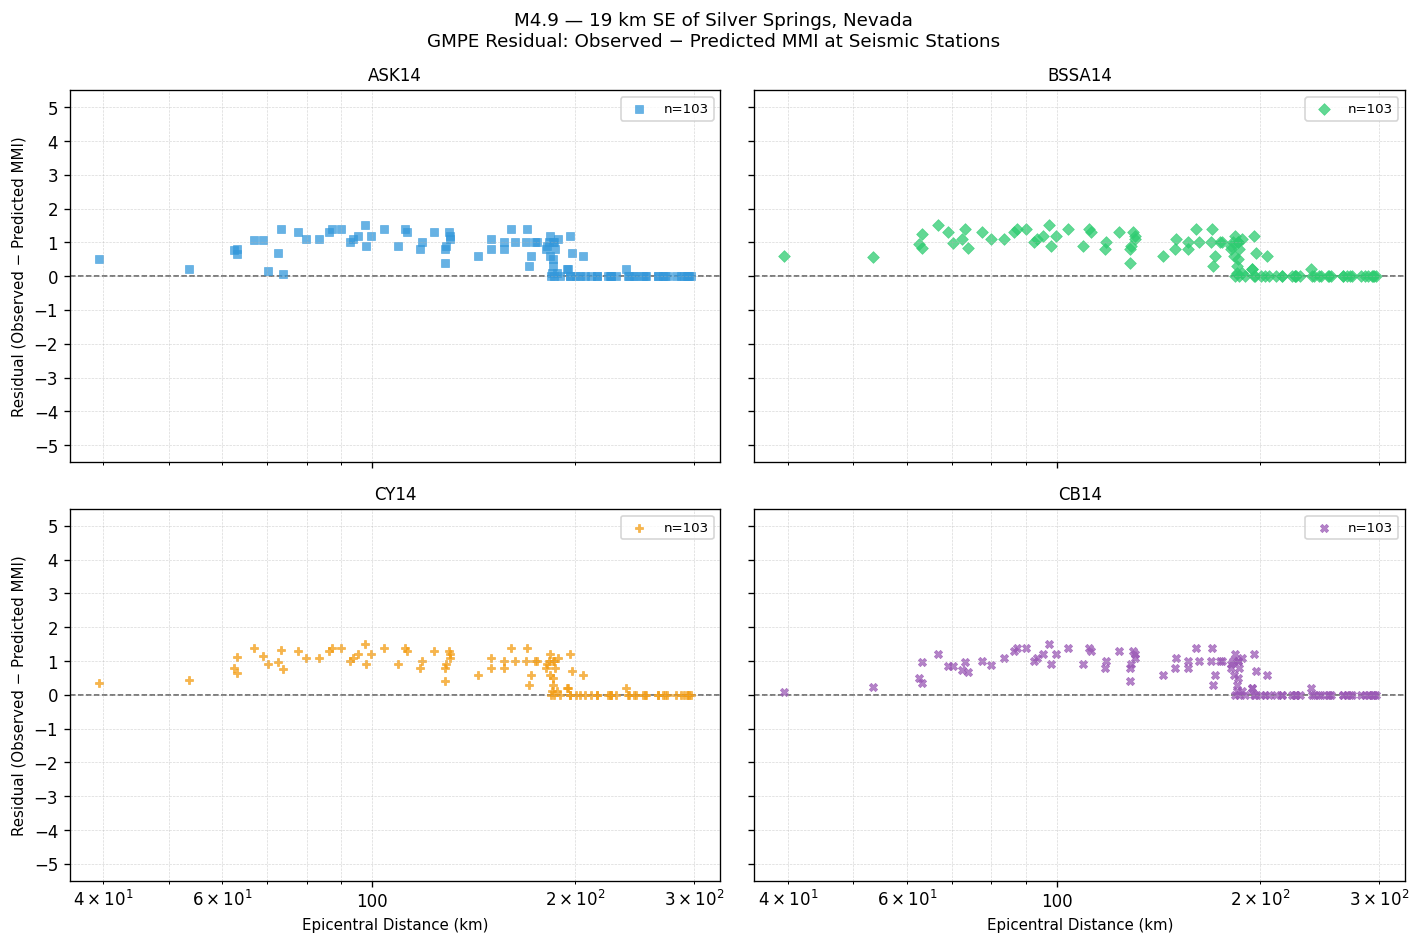
GMPE Residual — Observed − Predicted MMI
Signed residual at each seismic station. Positive values mean the GMPE underestimated shaking; negative values mean it overestimated. The dashed line at zero indicates perfect agreement.
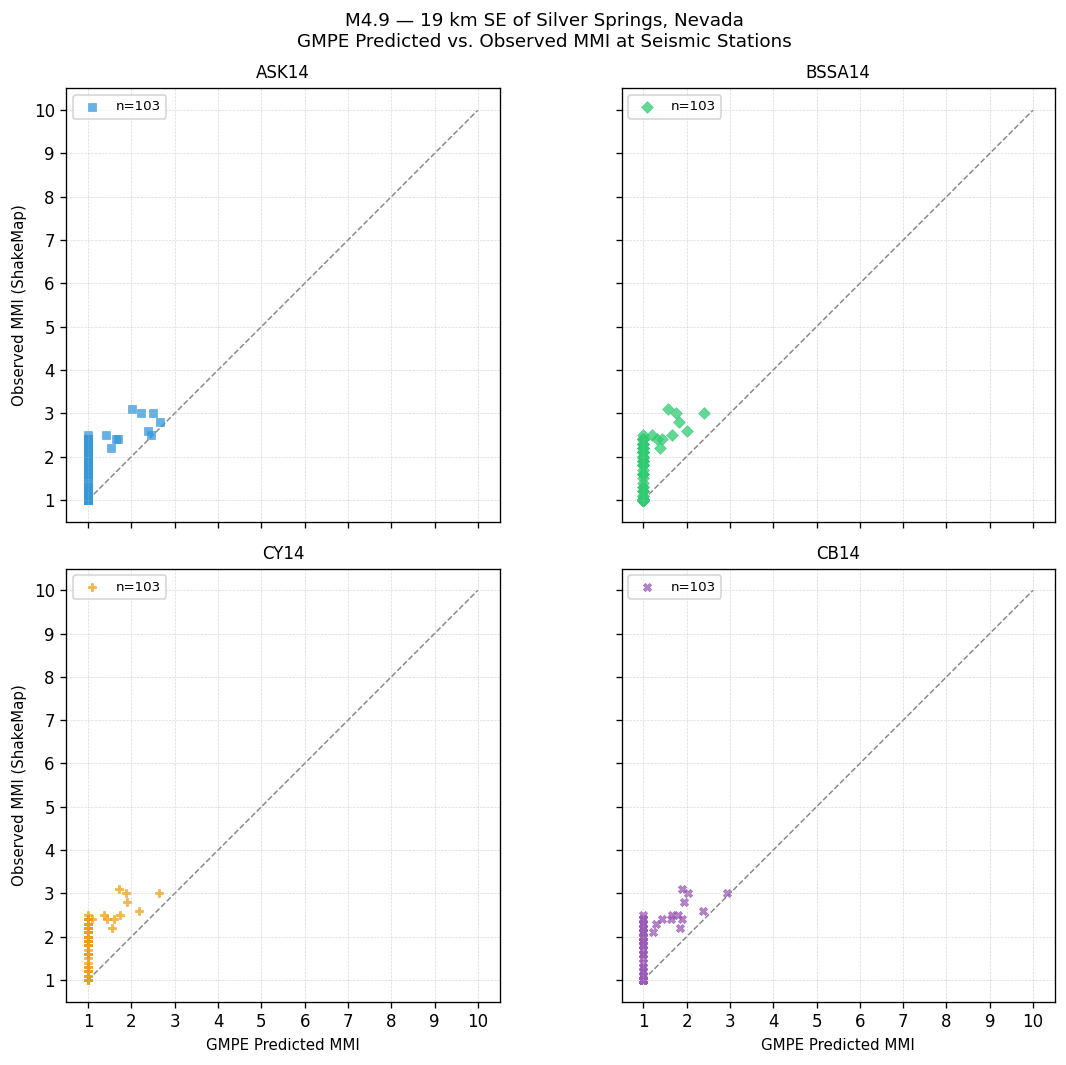
GMPE Predicted vs. Observed MMI at Seismic Stations
Each point is one seismic station. Points on the dashed 1:1 line indicate perfect agreement; above the line = GMPE underestimated shaking; below = overestimated.
GMPE Performance — Station Observations
Statistics computed by comparing each GMPE's predicted MMI against ShakeMap observed MMI at seismic stations. Bias = mean(observed − predicted). Lower RMSE indicates better overall agreement with instrumental measurements.
| GMPE | Bias | Sigma | RMSE |
|---|---|---|---|
| ASK14 | +0.62 | 0.54 | 0.82 |
| BSSA14 | +0.46 | 0.50 | 0.68 |
| CY14 | +0.68 | 0.54 | 0.86 |
| CB14 | +0.64 | 0.52 | 0.82 |
Peak Ground Motion — Seismic Station Observations
Recorded PGA and PGV at seismic stations, sorted by highest PGA. Top 25 stations shown. MMI (PGA) and MMI (PGV) are independent conversions via Worden et al. (2012) GMICE.
| Station | PGA (g) | MMI (PGA) | PGV (cm/s) | MMI (PGV) |
|---|---|---|---|---|
| Hidden Valley Golf Course w84gm (NN.HVGC) | 0.0145 | Weak(II) | 0.530 | Weak(III) |
| National Weather Station w84gm (NN.NOAA) | 0.0079 | Not felt(I) | 0.286 | Weak(III) |
| Buffalo Canyon, Nevada w84gm (NN.BFC) | 0.0069 | Not felt(I) | 0.370 | Weak(III) |
| Spanish Springs Fire Station (NN.SSFS) | 0.0069 | Not felt(I) | 0.378 | Weak(III) |
| Carson City Fire Station (NN.CF03) | 0.0069 | Not felt(I) | 0.488 | Weak(III) |
| Carson City Fire Station (NN.CF02) | 0.0060 | Not felt(I) | 0.294 | Weak(III) |
| Carson City School Admin. w84 (NN.CCAD) | 0.0051 | Not felt(I) | 0.186 | Weak(II) |
| Yerington, Nevada w84gm (NN.YER) | 0.0050 | Not felt(I) | 0.336 | Weak(III) |
| Picolo Elementary School w84gm (NN.PICO) | 0.0048 | Not felt(I) | 0.247 | Weak(II) |
| Sparks Marina w84 (NN.SMRN) | 0.0048 | Not felt(I) | 0.441 | Weak(III) |
| Washoe County Golf w84gm (NN.WGLF) | 0.0045 | Not felt(I) | 0.384 | Weak(III) |
| RF05, 1500 Mayberry w84gm (NN.RF05) | 0.0044 | Not felt(I) | 0.176 | Weak(II) |
| Broken Hills, NV, USA (NN.BRH5) | 0.0039 | Not felt(I) | 0.168 | Weak(II) |
| Eagle Valley School, CC w84 (NN.EGLV) | 0.0038 | Not felt(I) | 0.175 | Weak(II) |
| Dixie Hot Springs, Nevada w84 (NN.DIX) | 0.0035 | Not felt(I) | 0.184 | Weak(II) |
| Pah Rah Range, Nevada w84gm (NN.PAH) | 0.0032 | Not felt(I) | 0.158 | Weak(II) |
| Bishop Manogue Catholic High School, Reno, NV (NN.BMHS) | 0.0032 | Not felt(I) | 0.295 | Weak(III) |
| Nevada Mental Health Svc. w84gm (NN.NMHS) | 0.0031 | Not felt(I) | 0.218 | Weak(II) |
| RF10, 5250 N. Virginia w84gm (NN.RFNV) | 0.0029 | Not felt(I) | 0.174 | Weak(II) |
| Sparks High School w84 (NN.SPHI) | 0.0028 | Not felt(I) | 0.290 | Weak(III) |
| Bunker Hill, Placer County, CA (NN.BUNK) | 0.0028 | Not felt(I) | 0.063 | Weak(II) |
| Queen Bee, Mono County, California (NN.QNBC) | 0.0026 | Not felt(I) | 0.110 | Weak(II) |
| Pyramid Lake 2 (NN.PYM2) | 0.0026 | Not felt(I) | 0.098 | Weak(II) |
| Rockland Comm. Site (NN.RKLD) | 0.0025 | Not felt(I) | 0.130 | Weak(II) |
| Thunderbird Lodge, Lake Tahoe, NV (NN.TBRD) | 0.0025 | Not felt(I) | 0.099 | Weak(II) |