Max Est. MMI
26 km WNW of Ludlow, CA
Ground Shaking Intensities — Interpolated ShakeMap MMI
3 sites| Location | MMI Description |
|---|---|
|
Fort Irwin
CA |
Weak(II) |
|
Barstow
CA |
Weak(II) |
|
Barstow Heights
CA |
Weak(II) |
Seismic Station Observed MMI
MMI values are derived directly from observed ground motion measurements at seismic stations and are not spatially interpolated.
| Station | MMI Description |
|---|---|
| Hector (CI.HEC) | Light(IV) |
| Newberry Springs (CI.NBS) | Weak(III) |
| Rodman Mountain (CI.RMM) | Weak(II) |
Engineering Ground Motion Parameters
GMPE predictions provide an independent check on the ShakeMap interpolated intensities above.
ShakeMap relies on seismic station recordings; in areas with sparse station coverage — or
for large teleseismic events and earthquakes outside dense West Coast networks — ShakeMap
MMI can be inaccurate. A significant difference between ShakeMap and GMPE estimates is a signal
that the ShakeMap result should be treated as preliminary.
Also includes site Vs30 values and raw ground motion parameters (PGA/PGV).
Show ▼
Engineering Ground Motion Parameters
GMPE predictions provide an independent check on the ShakeMap interpolated intensities above. ShakeMap relies on seismic station recordings; in areas with sparse station coverage — or for large teleseismic events and earthquakes outside dense West Coast networks — ShakeMap MMI can be inaccurate. A significant difference between ShakeMap and GMPE estimates is a signal that the ShakeMap result should be treated as preliminary. Also includes site Vs30 values and raw ground motion parameters (PGA/PGV).
Est. Vs30 Values
Estimated shear-wave velocity in the upper 30 m used in GMPE calculations. Ref. column shows the 760 m/s rock-site reference for comparison.
| Location | Ref. (760 m/s) | Est. Vs30 (m/s) |
|---|---|---|
|
Fort Irwin
CA |
760 | 352 |
|
Barstow
CA |
760 | 352 |
|
Barstow Heights
CA |
760 | 352 |
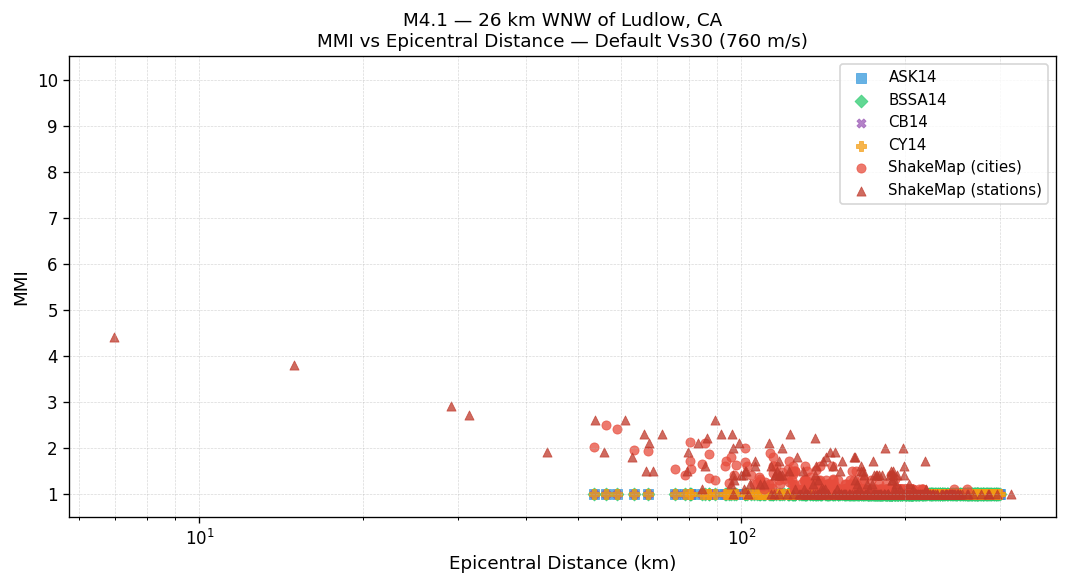
MMI vs Distance — Default Vs30 (760 m/s)
All methods using the 760 m/s rock-site reference. ShakeMap values are independent of Vs30.
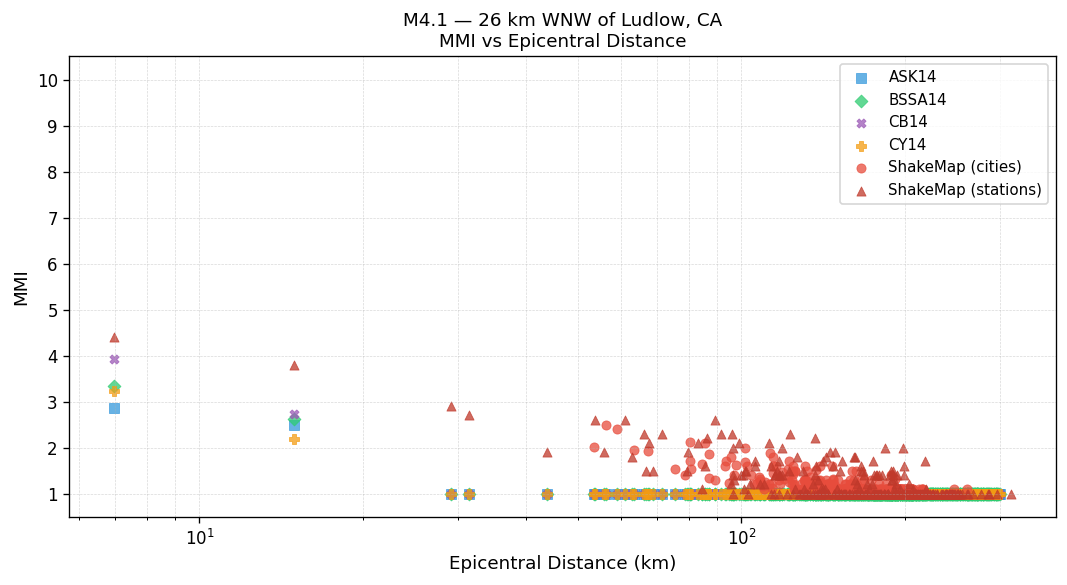
MMI vs Distance — Est. Vs30
GMPEs use the Est. Vs30 values shown in the table above. ShakeMap values are independent of Vs30.
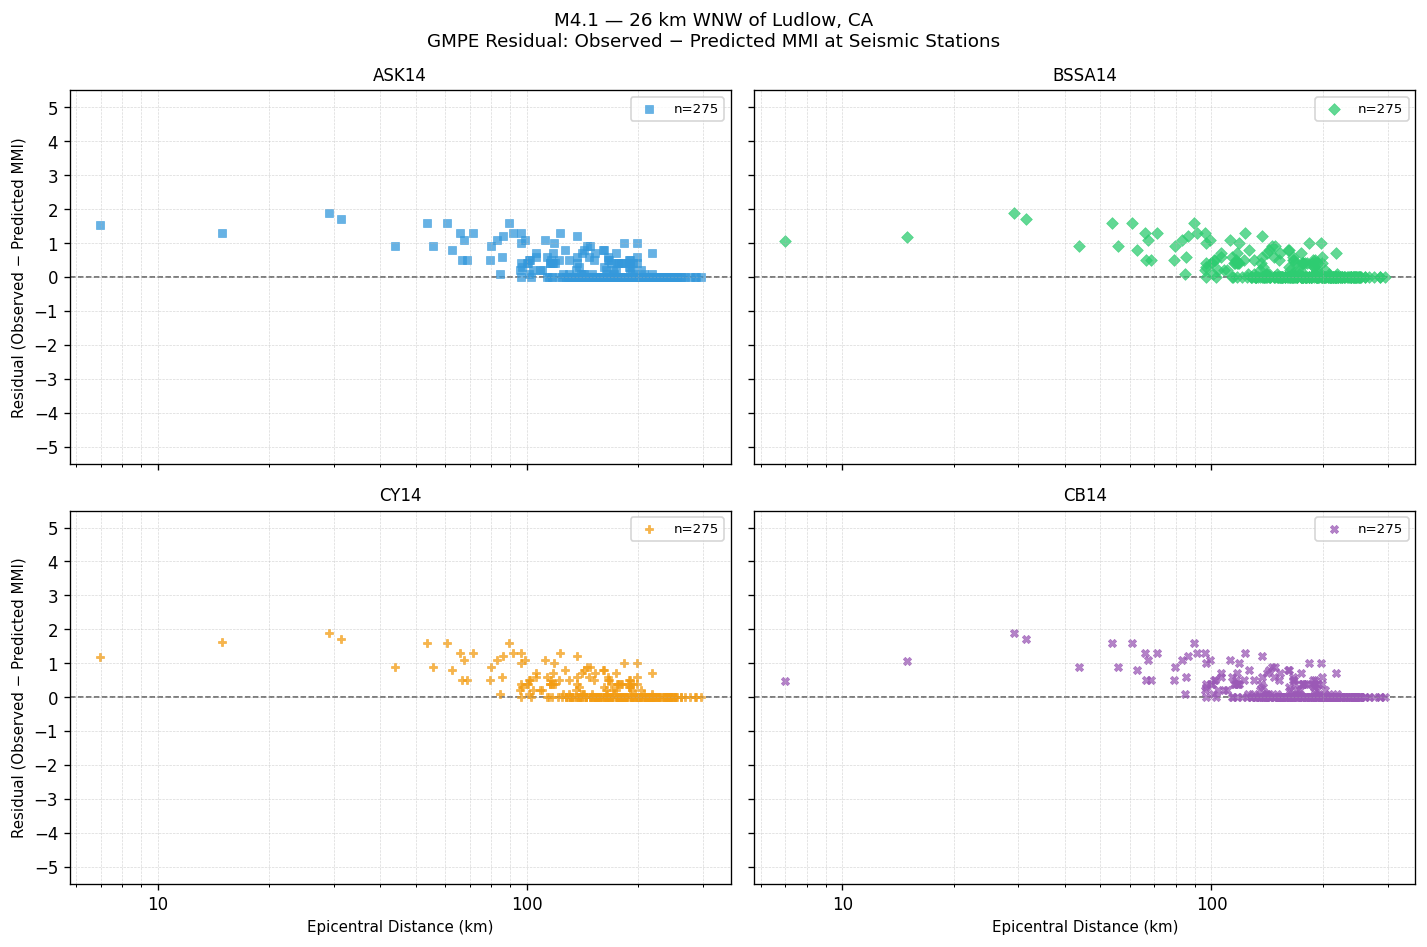
GMPE Residual — Observed − Predicted MMI
Signed residual at each seismic station. Positive values mean the GMPE underestimated shaking; negative values mean it overestimated. The dashed line at zero indicates perfect agreement.
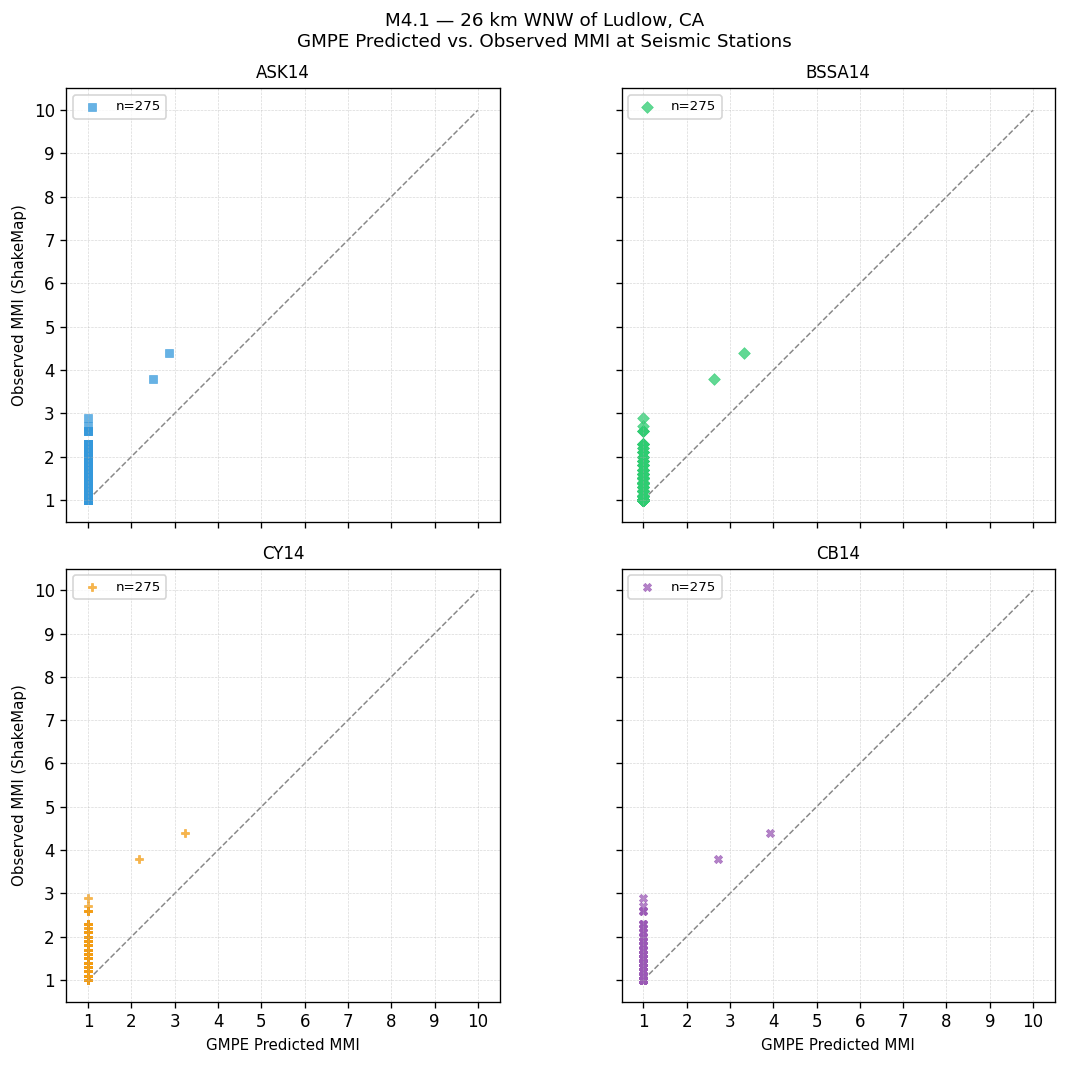
GMPE Predicted vs. Observed MMI at Seismic Stations
Each point is one seismic station. Points on the dashed 1:1 line indicate perfect agreement; above the line = GMPE underestimated shaking; below = overestimated.
GMPE Performance — Station Observations
Statistics computed by comparing each GMPE's predicted MMI against ShakeMap observed MMI at seismic stations. Bias = mean(observed − predicted). Lower RMSE indicates better overall agreement with instrumental measurements.
| GMPE | Bias | Sigma | RMSE |
|---|---|---|---|
| ASK14 | +0.23 | 0.40 | 0.46 |
| BSSA14 | +0.23 | 0.39 | 0.45 |
| CY14 | +0.23 | 0.40 | 0.46 |
| CB14 | +0.23 | 0.39 | 0.45 |
Peak Ground Motion — Seismic Station Observations
Recorded PGA and PGV at seismic stations, sorted by highest PGA. Top 25 stations shown. MMI (PGA) and MMI (PGV) are independent conversions via Worden et al. (2012) GMICE.
| Station | PGA (g) | MMI (PGA) | PGV (cm/s) | MMI (PGV) |
|---|---|---|---|---|
| Hector (CI.HEC) | 0.0357 | Light(IV) | 1.943 | Moderate(V) |
| Newberry Springs (CI.NBS) | 0.0241 | Weak(III) | 0.760 | Light(IV) |
| Rodman Mountain (CI.RMM) | 0.0051 | Not felt(I) | 0.187 | Weak(II) |
| Alvord Mountain (CI.AVM) | 0.0037 | Not felt(I) | 0.133 | Weak(II) |
| Victorville (CI.VTV) | 0.0035 | Not felt(I) | 0.118 | Weak(II) |
| Barstow Service Center (CI.RRX) | 0.0027 | Not felt(I) | 0.127 | Weak(II) |
| Goat Mountain Astronomical Research Station (CI.GMA) | 0.0026 | Not felt(I) | 0.122 | Weak(II) |
| Yucca Valley (CI.YUC) | 0.0021 | Not felt(I) | 0.079 | Weak(II) |
| Wilsona 2 (CI.WLS2) | 0.0020 | Not felt(I) | 0.082 | Weak(II) |
| Sunset Peak (CI.SUN) | 0.0018 | Not felt(I) | 0.067 | Weak(II) |
| Barstow (CI.BAW) | 0.0018 | Not felt(I) | 0.061 | Weak(II) |
| Mission Creek (CI.MSC) | 0.0016 | Not felt(I) | 0.081 | Weak(II) |
| Mountain Pass (CI.MTP) | 0.0015 | Not felt(I) | 0.037 | Not felt(I) |
| Anaheim (CE.13883) | 0.0015 | Not felt(I) | 0.020 | Not felt(I) |
| Granite Mountains Research Center (CI.GMR) | 0.0015 | Not felt(I) | 0.030 | Not felt(I) |
| Crystal Lake 2 (CI.XTL2) | 0.0015 | Not felt(I) | 0.048 | Not felt(I) |
| Hole In The Wall (CI.HIW) | 0.0014 | Not felt(I) | 0.076 | Weak(II) |
| Adelanto Receiving (CI.ADO) | 0.0014 | Not felt(I) | 0.059 | Weak(II) |
| Turquoise Mountain (CI.TUQ) | 0.0013 | Not felt(I) | 0.046 | Not felt(I) |
| Cajon Mountain (CI.CJM) | 0.0012 | Not felt(I) | 0.057 | Weak(II) |
| Lucerne Valley 2 (CI.LUC2) | 0.0012 | Not felt(I) | 0.072 | Weak(II) |
| Big Bear Solar Observatory (CI.BBR) | 0.0011 | Not felt(I) | 0.030 | Not felt(I) |
| Fish Rocks (CI.FSR) | 0.0011 | Not felt(I) | 0.032 | Not felt(I) |
| 5030, Palmdale, CA (LT2) (NP.5030) | 0.0010 | Not felt(I) | 0.047 | Not felt(I) |
| Shoshone (CI.SHO) | 0.0010 | Not felt(I) | 0.052 | Not felt(I) |