Max Est. MMI
2004 Parkfield, California Earthquake
Ground Shaking Intensities — Interpolated ShakeMap MMI
13 sites| Location | MMI Description |
|---|---|
|
San Miguel
CA |
Very Strong(VII) |
|
Avenal
CA |
Strong(VI) |
|
Coalinga
CA |
Moderate(V) |
|
Paso Robles
CA |
Moderate(V) |
|
Lake Nacimiento
CA |
Moderate(V) |
|
Shandon
CA |
Moderate(V) |
|
Templeton
CA |
Moderate(V) |
|
Kettleman City
CA |
Moderate(V) |
|
Huron
CA |
Moderate(V) |
|
Atascadero
CA |
Moderate(V) |
|
Cayucos
CA |
Light(IV) |
|
Cambria
CA |
Light(IV) |
|
Lemoore Station
CA |
Light(IV) |
Shaking Animations
Simulated bowling pin shaking at each city’s intensity level. Videos appear as they finish rendering.
| Location | MMI Description | Animation |
|---|---|---|
| San Miguel | Very Strong(VII) | |
| Avenal | Strong(VI) | Download |
| Coalinga | Moderate(V) |
Seismic Station Observed MMI
MMI values are derived directly from observed ground motion measurements at seismic stations and are not spatially interpolated.
Engineering Ground Motion Parameters
GMPE predictions provide an independent check on the ShakeMap interpolated intensities above.
ShakeMap relies on seismic station recordings; in areas with sparse station coverage — or
for large teleseismic events and earthquakes outside dense West Coast networks — ShakeMap
MMI can be inaccurate. A significant difference between ShakeMap and GMPE estimates is a signal
that the ShakeMap result should be treated as preliminary.
Also includes site Vs30 values and raw ground motion parameters (PGA/PGV).
Show ▼
Engineering Ground Motion Parameters
GMPE predictions provide an independent check on the ShakeMap interpolated intensities above. ShakeMap relies on seismic station recordings; in areas with sparse station coverage — or for large teleseismic events and earthquakes outside dense West Coast networks — ShakeMap MMI can be inaccurate. A significant difference between ShakeMap and GMPE estimates is a signal that the ShakeMap result should be treated as preliminary. Also includes site Vs30 values and raw ground motion parameters (PGA/PGV).
Est. Vs30 Values
Estimated shear-wave velocity in the upper 30 m used in GMPE calculations. Ref. column shows the 760 m/s rock-site reference for comparison.
| Location | Ref. (760 m/s) | Est. Vs30 (m/s) |
|---|---|---|
|
San Miguel
CA |
760 | 416 |
|
Avenal
CA |
760 | 294 |
|
Coalinga
CA |
760 | 320 |
|
Paso Robles
CA |
760 | 416 |
|
Lake Nacimiento
CA |
760 | 468 |
|
Shandon
CA |
760 | 345 |
|
Templeton
CA |
760 | 398 |
|
Kettleman City
CA |
760 | 385 |
|
Huron
CA |
760 | 228 |
|
Atascadero
CA |
760 | 385 |
|
Cayucos
CA |
760 | 733 |
|
Cambria
CA |
760 | 464 |
|
Lemoore Station
CA |
760 | 228 |
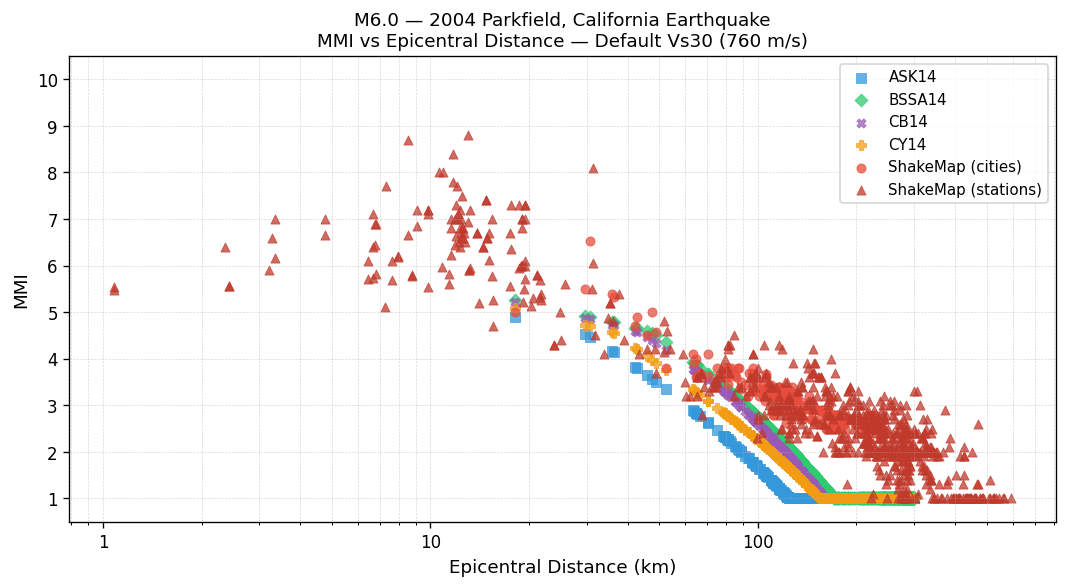
MMI vs Distance — Default Vs30 (760 m/s)
All methods using the 760 m/s rock-site reference. ShakeMap values are independent of Vs30.
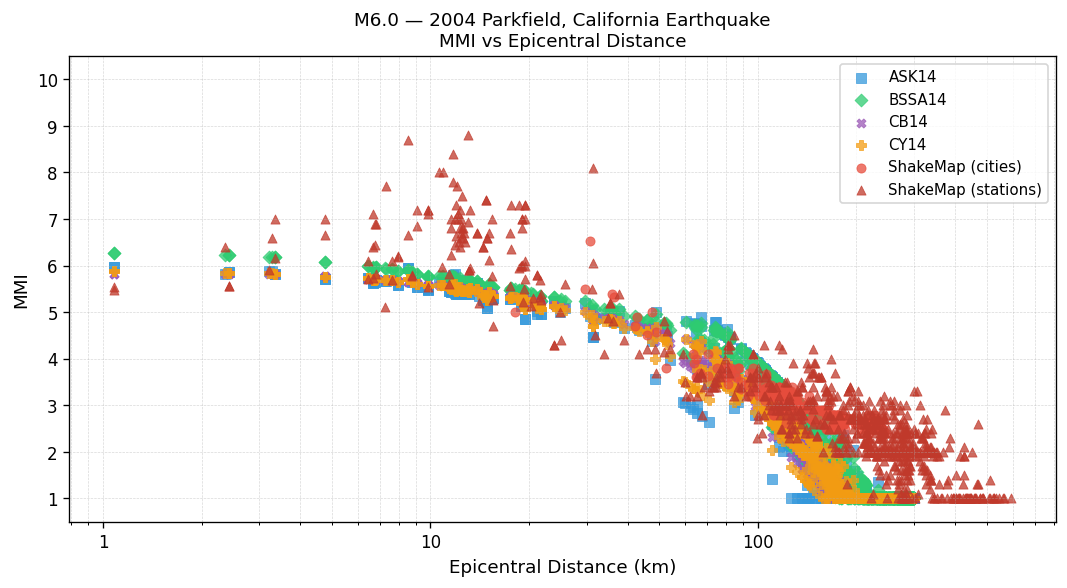
MMI vs Distance — Est. Vs30
GMPEs use the Est. Vs30 values shown in the table above. ShakeMap values are independent of Vs30.
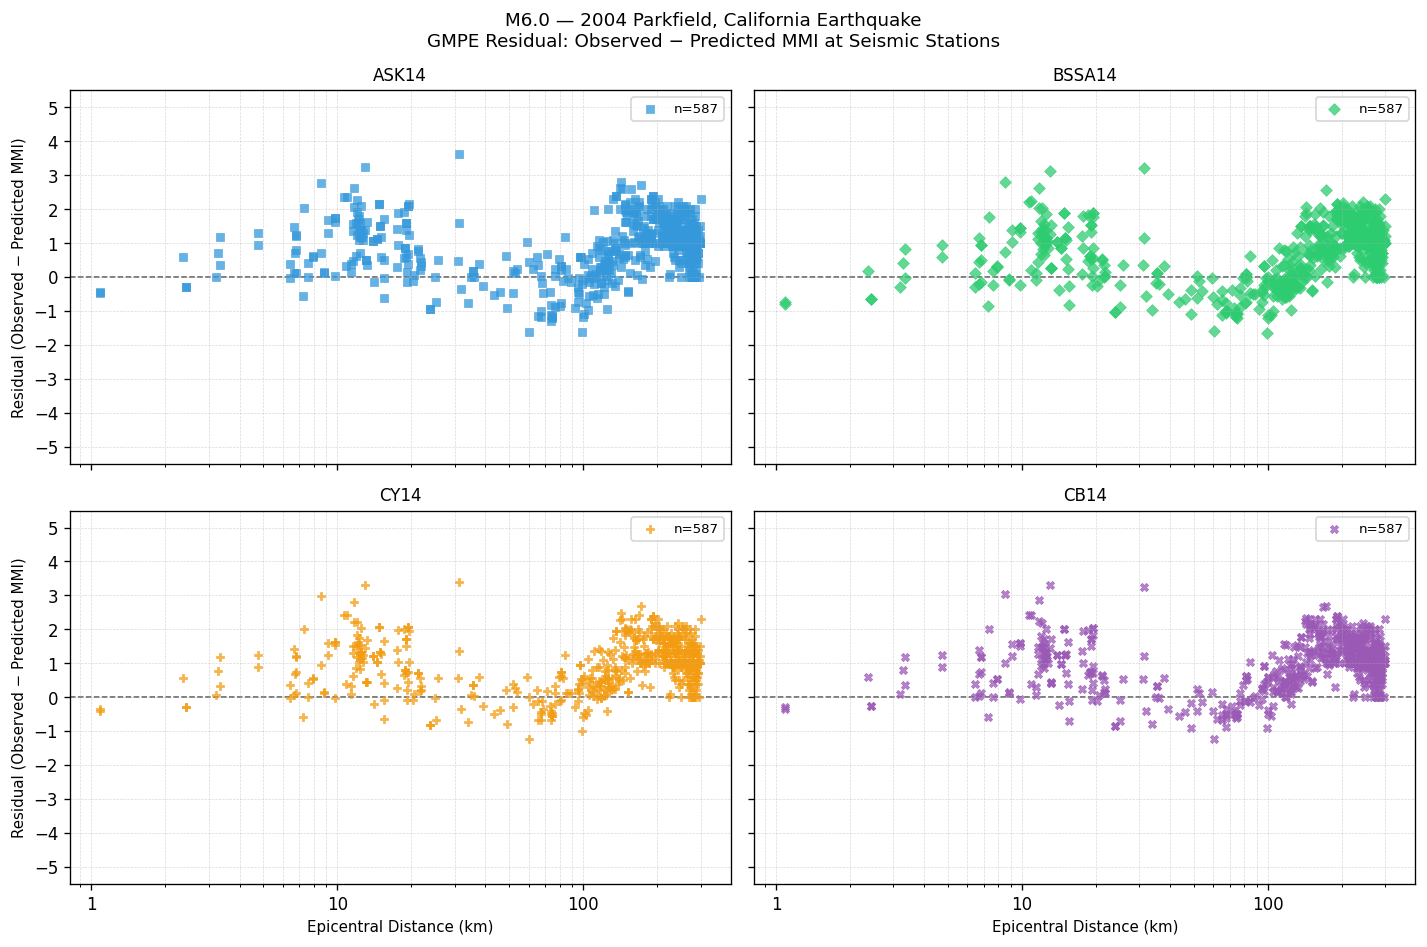
GMPE Residual — Observed − Predicted MMI
Signed residual at each seismic station. Positive values mean the GMPE underestimated shaking; negative values mean it overestimated. The dashed line at zero indicates perfect agreement.
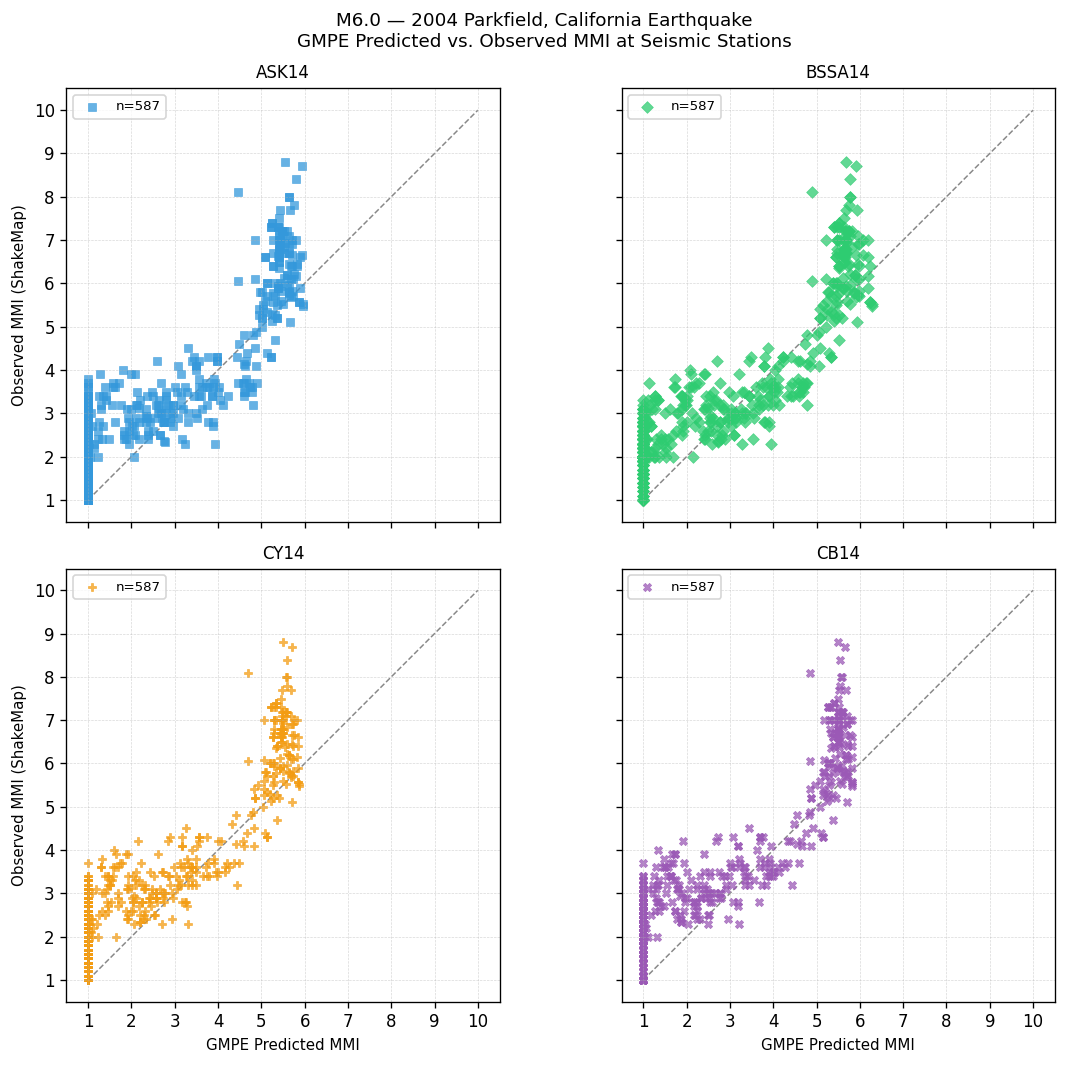
GMPE Predicted vs. Observed MMI at Seismic Stations
Each point is one seismic station. Points on the dashed 1:1 line indicate perfect agreement; above the line = GMPE underestimated shaking; below = overestimated.
GMPE Performance — Station Observations
Statistics computed by comparing each GMPE's predicted MMI against ShakeMap observed MMI at seismic stations. Bias = mean(observed − predicted). Lower RMSE indicates better overall agreement with instrumental measurements.
| GMPE | Bias | Sigma | RMSE |
|---|---|---|---|
| ASK14 | +0.91 | 0.83 | 1.24 |
| BSSA14 | +0.74 | 0.85 | 1.13 |
| CY14 | +0.97 | 0.74 | 1.22 |
| CB14 | +0.97 | 0.75 | 1.23 |
Peak Ground Motion — Seismic Station Observations
Recorded PGA and PGV at seismic stations, sorted by highest PGA. Top 25 stations shown. MMI (PGA) and MMI (PGV) are independent conversions via Worden et al. (2012) GMICE.
| Station | PGA (g) | MMI (PGA) | PGV (cm/s) | MMI (PGV) |
|---|---|---|---|---|
| Parkfield, CA (G.Z14) | 1.3124 | Very Strong(VII) | 83.080 | Extreme(X) |
| Parkfield - Fault Zone 14 (CE.36456) | 1.3096 | Very Strong(VII) | — | — |
| Parkfield - Fault Zone 11 (CE.36453) | 1.1296 | Very Strong(VII) | — | — |
| Parkfield, CA (G.Z11) | 0.9216 | Very Strong(VII) | 25.690 | Violent(IX) |
| Parkfield - Fault Zone 1 (CE.36407) | 0.8497 | Very Strong(VII) | — | — |
| Parkfield - Gold Hill 3W (CE.36420) | 0.8497 | Very Strong(VII) | — | — |
| Parkfield - Cholame 3E (CE.36450) | 0.8197 | Very Strong(VII) | — | — |
| Parkfield, CA (G.COW) | 0.8193 | Very Strong(VII) | 81.220 | Extreme(X) |
| Parkfield, CA (G.SC1) | 0.8089 | Very Strong(VII) | 39.000 | Violent(IX) |
| Parkfield, CA (G.TM3) | 0.7495 | Very Strong(VII) | 27.530 | Violent(IX) |
| Parkfield, CA (G.PG3) | 0.6789 | Strong(VI) | 22.770 | Violent(IX) |
| Parkfield - Cholame 2W (Sta 2) (CE.36228) | 0.6298 | Strong(VI) | — | — |
| Parkfield - Fault Zone 8 (CE.36449) | 0.6298 | Strong(VI) | — | — |
| Parkfield, CA (G.HIST_51) | 0.6214 | Strong(VI) | 30.300 | Violent(IX) |
| Joaquin Canyon (CE.JFU) | 0.6208 | Strong(VI) | 30.300 | Violent(IX) |
| Parkfield, CA (G.C02) | 0.6050 | Strong(VI) | 63.320 | Extreme(X) |
| Parkfield - Cholame 3W (CE.36410) | 0.5798 | Strong(VI) | — | — |
| Parkfield, CA (G.C04) | 0.5765 | Strong(VI) | 31.800 | Violent(IX) |
| Parkfield, CA (G.C03) | 0.5653 | Strong(VI) | 38.020 | Violent(IX) |
| Parkfield - Vineyard Canyon 2W (CE.36447) | 0.5498 | Strong(VI) | — | — |
| Parkfield, CA (G.Z08) | 0.5467 | Strong(VI) | 20.590 | Severe(VIII) |
| Parkfield, CA (G.VC2) | 0.5178 | Strong(VI) | 27.440 | Violent(IX) |
| Parkfield, CA (G.TM2) | 0.4741 | Strong(VI) | 22.740 | Violent(IX) |
| Parkfield, CA (G.HIST_35) | 0.4653 | Strong(VI) | 27.200 | Violent(IX) |
| Parkfield, CA (G.HIST_49) | 0.4571 | Strong(VI) | 17.500 | Severe(VIII) |