Max Est. MMI
2 km NW of The Geysers, CA
Ground Shaking Intensities — Interpolated ShakeMap MMI
3 sites| Location | MMI Description |
|---|---|
|
Cobb
CA |
Light(IV) |
|
Middletown
CA |
Weak(III) |
|
Clear Lake Riviera
CA |
Weak(III) |
Seismic Station Observed MMI
MMI values are derived directly from observed ground motion measurements at seismic stations and are not spatially interpolated.
| Station | MMI Description |
|---|---|
| Geysers (NC.GDXB) | Moderate(V) |
| Geyser Peak (NC.GGPC) | Light(IV) |
| Alexander Valley (NC.GAXB) | Light(IV) |
| Boggs Mountain (NC.GBG) | Light(IV) |
Engineering Ground Motion Parameters
GMPE predictions provide an independent check on the ShakeMap interpolated intensities above.
ShakeMap relies on seismic station recordings; in areas with sparse station coverage — or
for large teleseismic events and earthquakes outside dense West Coast networks — ShakeMap
MMI can be inaccurate. A significant difference between ShakeMap and GMPE estimates is a signal
that the ShakeMap result should be treated as preliminary.
Also includes site Vs30 values and raw ground motion parameters (PGA/PGV).
Show ▼
Engineering Ground Motion Parameters
GMPE predictions provide an independent check on the ShakeMap interpolated intensities above. ShakeMap relies on seismic station recordings; in areas with sparse station coverage — or for large teleseismic events and earthquakes outside dense West Coast networks — ShakeMap MMI can be inaccurate. A significant difference between ShakeMap and GMPE estimates is a signal that the ShakeMap result should be treated as preliminary. Also includes site Vs30 values and raw ground motion parameters (PGA/PGV).
Est. Vs30 Values
Estimated shear-wave velocity in the upper 30 m used in GMPE calculations. Ref. column shows the 760 m/s rock-site reference for comparison.
| Location | Ref. (760 m/s) | Est. Vs30 (m/s) |
|---|---|---|
|
Cobb
CA |
760 | 710 |
|
Middletown
CA |
760 | 294 |
|
Clear Lake Riviera
CA |
760 | 710 |
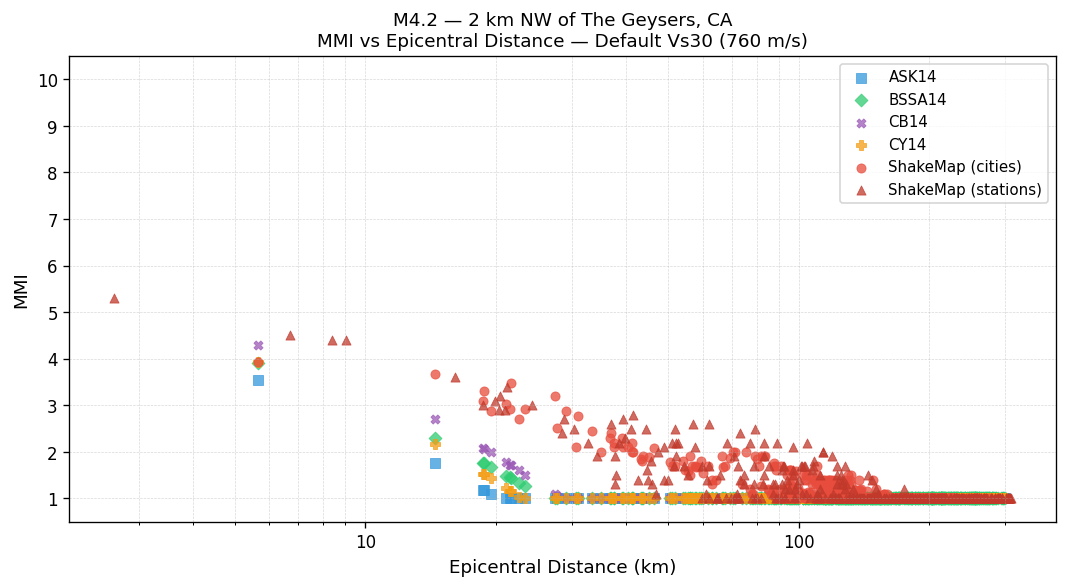
MMI vs Distance — Default Vs30 (760 m/s)
All methods using the 760 m/s rock-site reference. ShakeMap values are independent of Vs30.
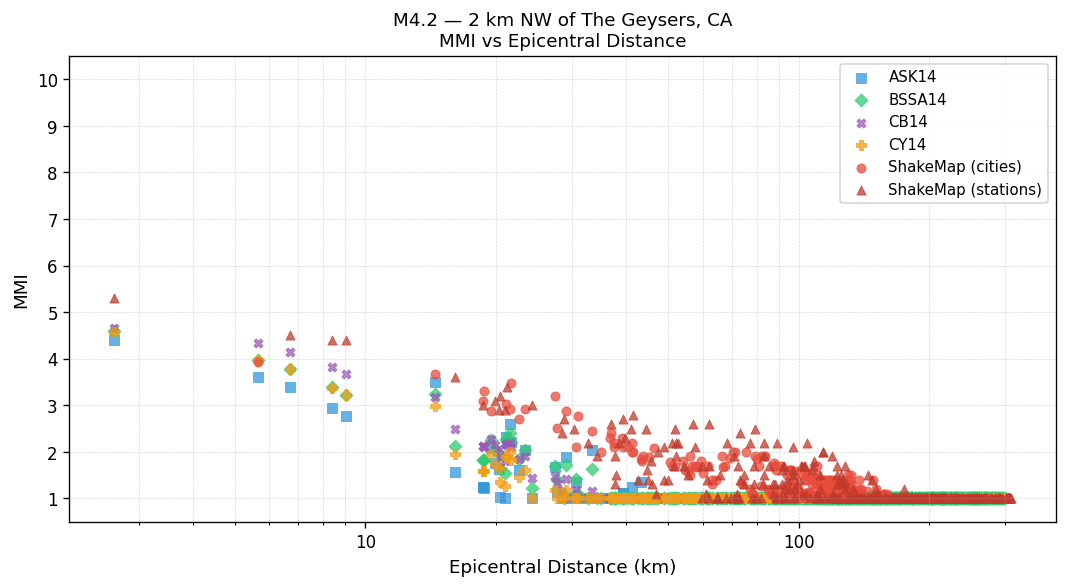
MMI vs Distance — Est. Vs30
GMPEs use the Est. Vs30 values shown in the table above. ShakeMap values are independent of Vs30.
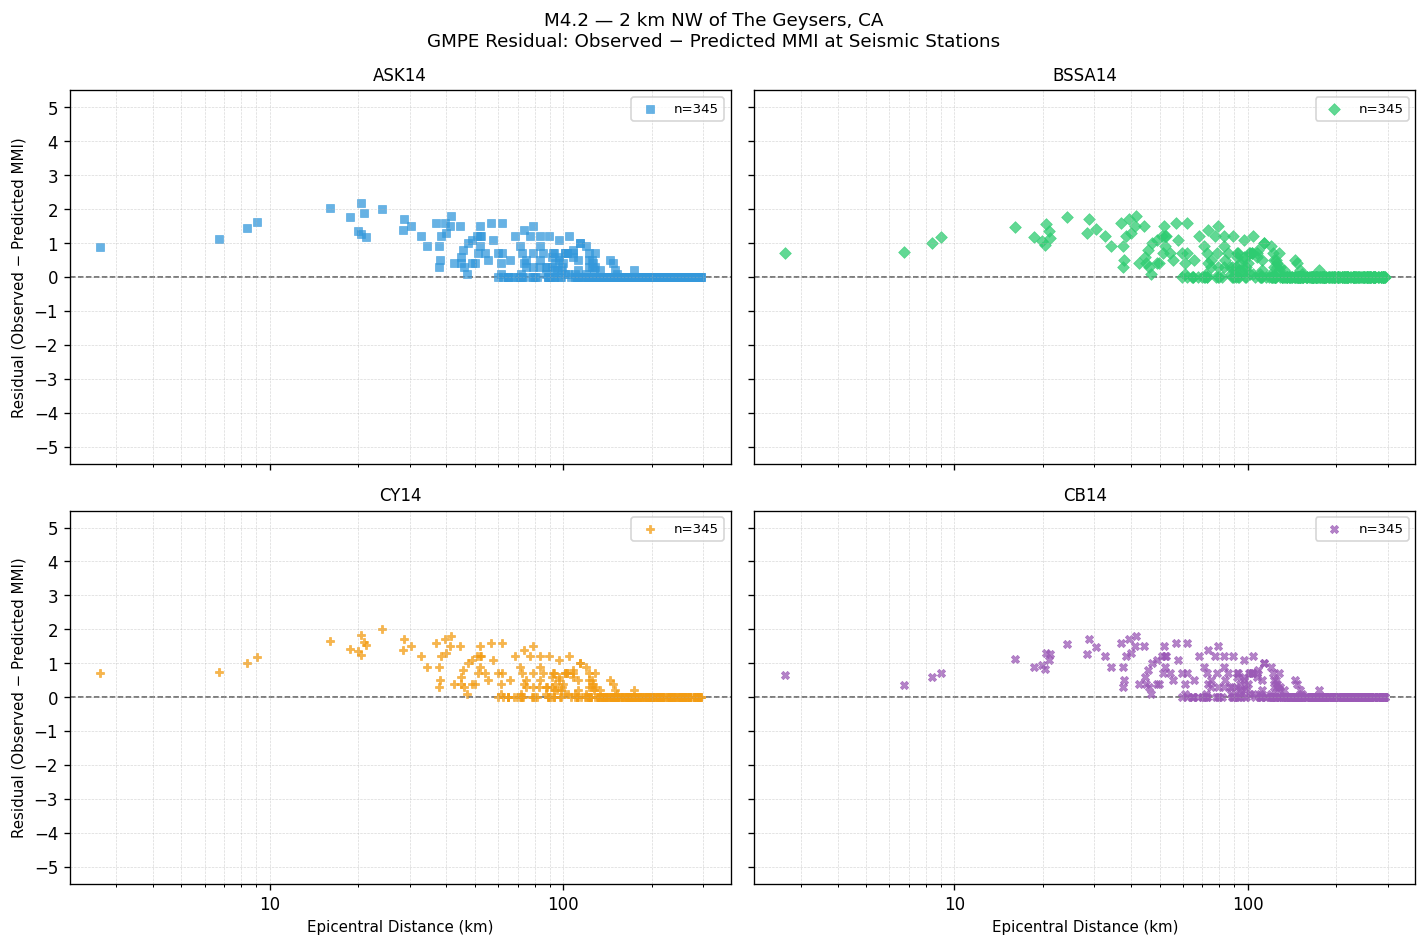
GMPE Residual — Observed − Predicted MMI
Signed residual at each seismic station. Positive values mean the GMPE underestimated shaking; negative values mean it overestimated. The dashed line at zero indicates perfect agreement.
GMPE Predicted vs. Observed MMI at Seismic Stations
Each point is one seismic station. Points on the dashed 1:1 line indicate perfect agreement; above the line = GMPE underestimated shaking; below = overestimated.
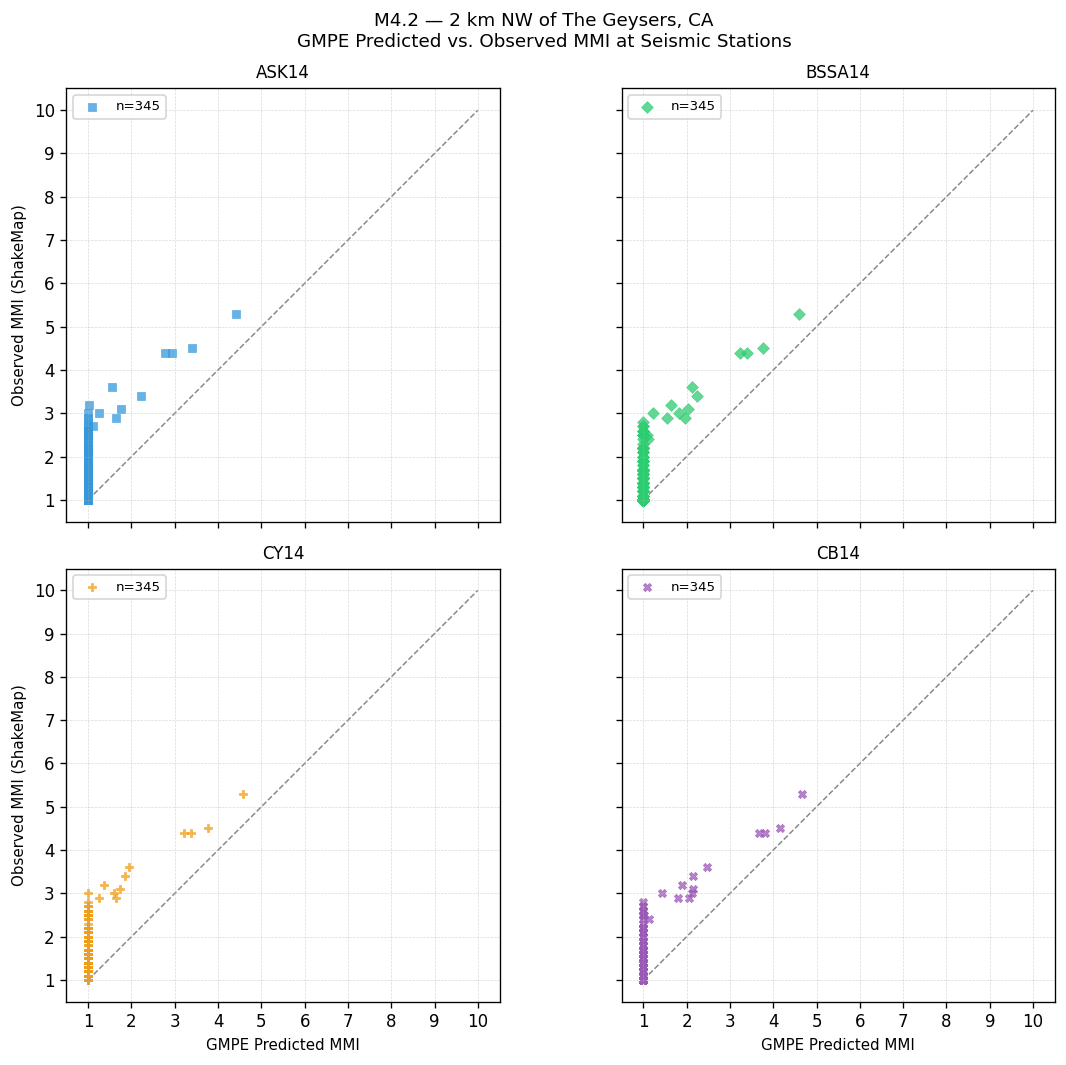
GMPE Performance — Station Observations
Statistics computed by comparing each GMPE's predicted MMI against ShakeMap observed MMI at seismic stations. Bias = mean(observed − predicted). Lower RMSE indicates better overall agreement with instrumental measurements.
| GMPE | Bias | Sigma | RMSE |
|---|---|---|---|
| ASK14 | +0.24 | 0.41 | 0.48 |
| BSSA14 | +0.22 | 0.38 | 0.44 |
| CY14 | +0.24 | 0.42 | 0.48 |
| CB14 | +0.22 | 0.39 | 0.45 |
Peak Ground Motion — Seismic Station Observations
Recorded PGA and PGV at seismic stations, sorted by highest PGA. Top 25 stations shown. MMI (PGA) and MMI (PGV) are independent conversions via Worden et al. (2012) GMICE.
| Station | PGA (g) | MMI (PGA) | PGV (cm/s) | MMI (PGV) |
|---|---|---|---|---|
| Geysers (NC.GDXB) | 0.1686 | Moderate(V) | 5.118 | Strong(VI) |
| Alexander Valley (NC.GAXB) | 0.0719 | Moderate(V) | 2.178 | Moderate(V) |
| Boggs Mountain (NC.GBG) | 0.0471 | Light(IV) | 1.983 | Moderate(V) |
| Geyser Peak (NC.GGPC) | 0.0449 | Light(IV) | 2.633 | Moderate(V) |
| Pine Mountain #1 (NC.GPM) | 0.0119 | Weak(II) | 0.598 | Weak(III) |
| Kelseyville (CE.68035) | 0.0079 | Not felt(I) | 0.642 | Weak(III) |
| Lake Bordeaux (NC.NLB) | 0.0066 | Not felt(I) | 0.282 | Weak(III) |
| Pepperwood Preserve (BK.PWOD) | 0.0065 | Not felt(I) | 0.243 | Weak(II) |
| Healdsburg Fire Station (NP.1744) | 0.0058 | Not felt(I) | 0.455 | Weak(III) |
| Santa Rosa FS 7 (NP.1835) | 0.0042 | Not felt(I) | 0.165 | Weak(II) |
| Weeks Lake (NC.NWS) | 0.0035 | Not felt(I) | 0.124 | Weak(II) |
| St. Helena Fire Department (NP.1764) | 0.0032 | Not felt(I) | 0.113 | Weak(II) |
| Skaggs, Las Lomas (BK.SKGS) | 0.0029 | Not felt(I) | 0.154 | Weak(II) |
| Glen Ellen FS Arnold (NP.1848) | 0.0028 | Not felt(I) | 0.114 | Weak(II) |
| Round Top Mountain (NC.GRT) | 0.0026 | Not felt(I) | 0.236 | Weak(II) |
| Mt.St.Helena South (NC.NHS) | 0.0024 | Not felt(I) | 0.195 | Weak(II) |
| Sonoma FS 1 (NP.1829) | 0.0024 | Not felt(I) | 0.118 | Weak(II) |
| Lloyd Lowery (NC.NLL) | 0.0024 | Not felt(I) | 0.114 | Weak(II) |
| Cloverdale #3 (NC.GCVB) | 0.0023 | Not felt(I) | 0.187 | Weak(II) |
| Bald Mountain (NC.NBM) | 0.0020 | Not felt(I) | 0.132 | Weak(II) |
| Top of Konocti (NC.GTK) | 0.0020 | Not felt(I) | 0.337 | Weak(III) |
| The Novato Fire Protection District "Fire Station 1" (NP.1762) | 0.0020 | Not felt(I) | 0.108 | Weak(II) |
| Middletown (NC.NMTB) | 0.0018 | Not felt(I) | 0.094 | Weak(II) |
| Oakville Experimental Vineyard, Oakville, CA (BK.OAKV) | 0.0016 | Not felt(I) | 0.067 | Weak(II) |
| Santa Rosa FS 1 (NP.1767) | 0.0015 | Not felt(I) | 0.137 | Weak(II) |