Max Est. MMI
20 km ESE of Silver Springs, Nevada
Ground Shaking Intensities — Interpolated ShakeMap MMI
4 sites| Location | MMI Description |
|---|---|
|
Silver Springs
NV |
Moderate(V) |
|
Yerington
NV |
Light(IV) |
|
Stagecoach
NV |
Light(IV) |
|
Fallon
NV |
Light(IV) |
Shaking Animations
Simulated bowling pin shaking at each city’s intensity level. Videos appear as they finish rendering.
| Location | Type | MMI Description | Animation |
|---|---|---|---|
| Silver Springs | Simulated | Moderate(V) |
Seismic Station Observed MMI
MMI values are derived directly from observed ground motion measurements at seismic stations and are not spatially interpolated.
| Station | MMI Description |
|---|---|
| Pine Nut, Nevada w84 (NN.PNT) | Light(IV) |
| Donner Summit, California (NN.DON) | Light(IV) |
| Yerington, Nevada w84gm (NN.YER) | Weak(III) |
Engineering Ground Motion Parameters
GMPE predictions provide an independent check on the ShakeMap interpolated intensities above.
ShakeMap relies on seismic station recordings; in areas with sparse station coverage — or
for large teleseismic events and earthquakes outside dense West Coast networks — ShakeMap
MMI can be inaccurate. A significant difference between ShakeMap and GMPE estimates is a signal
that the ShakeMap result should be treated as preliminary.
Also includes site Vs30 values and raw ground motion parameters (PGA/PGV).
Show ▼
Engineering Ground Motion Parameters
GMPE predictions provide an independent check on the ShakeMap interpolated intensities above. ShakeMap relies on seismic station recordings; in areas with sparse station coverage — or for large teleseismic events and earthquakes outside dense West Coast networks — ShakeMap MMI can be inaccurate. A significant difference between ShakeMap and GMPE estimates is a signal that the ShakeMap result should be treated as preliminary. Also includes site Vs30 values and raw ground motion parameters (PGA/PGV).
Est. Vs30 Values
Estimated shear-wave velocity in the upper 30 m used in GMPE calculations. Ref. column shows the 760 m/s rock-site reference for comparison.
| Location | Ref. (760 m/s) | Est. Vs30 (m/s) |
|---|---|---|
|
Silver Springs
NV |
760 | 322 |
|
Yerington
NV |
760 | 207 |
|
Stagecoach
NV |
760 | 370 |
|
Fallon
NV |
760 | 201 |
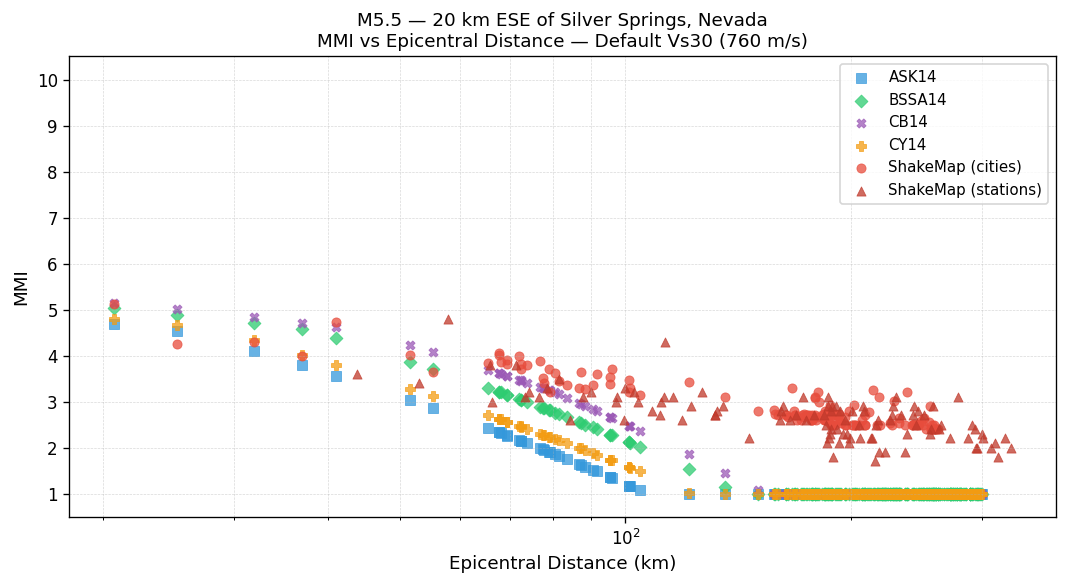
MMI vs Distance — Default Vs30 (760 m/s)
All methods using the 760 m/s rock-site reference. ShakeMap values are independent of Vs30.
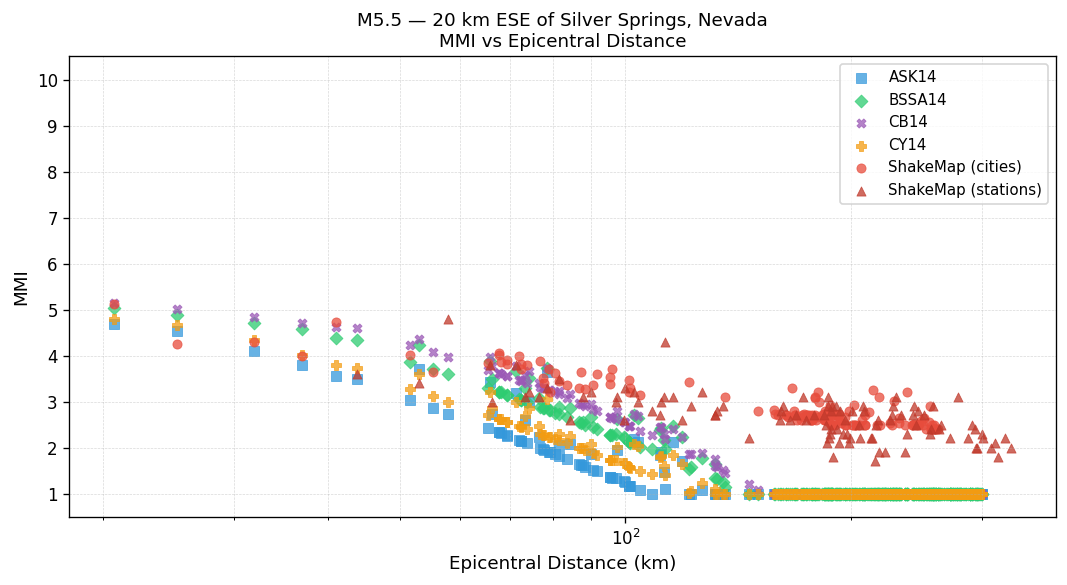
MMI vs Distance — Est. Vs30
GMPEs use the Est. Vs30 values shown in the table above. ShakeMap values are independent of Vs30.
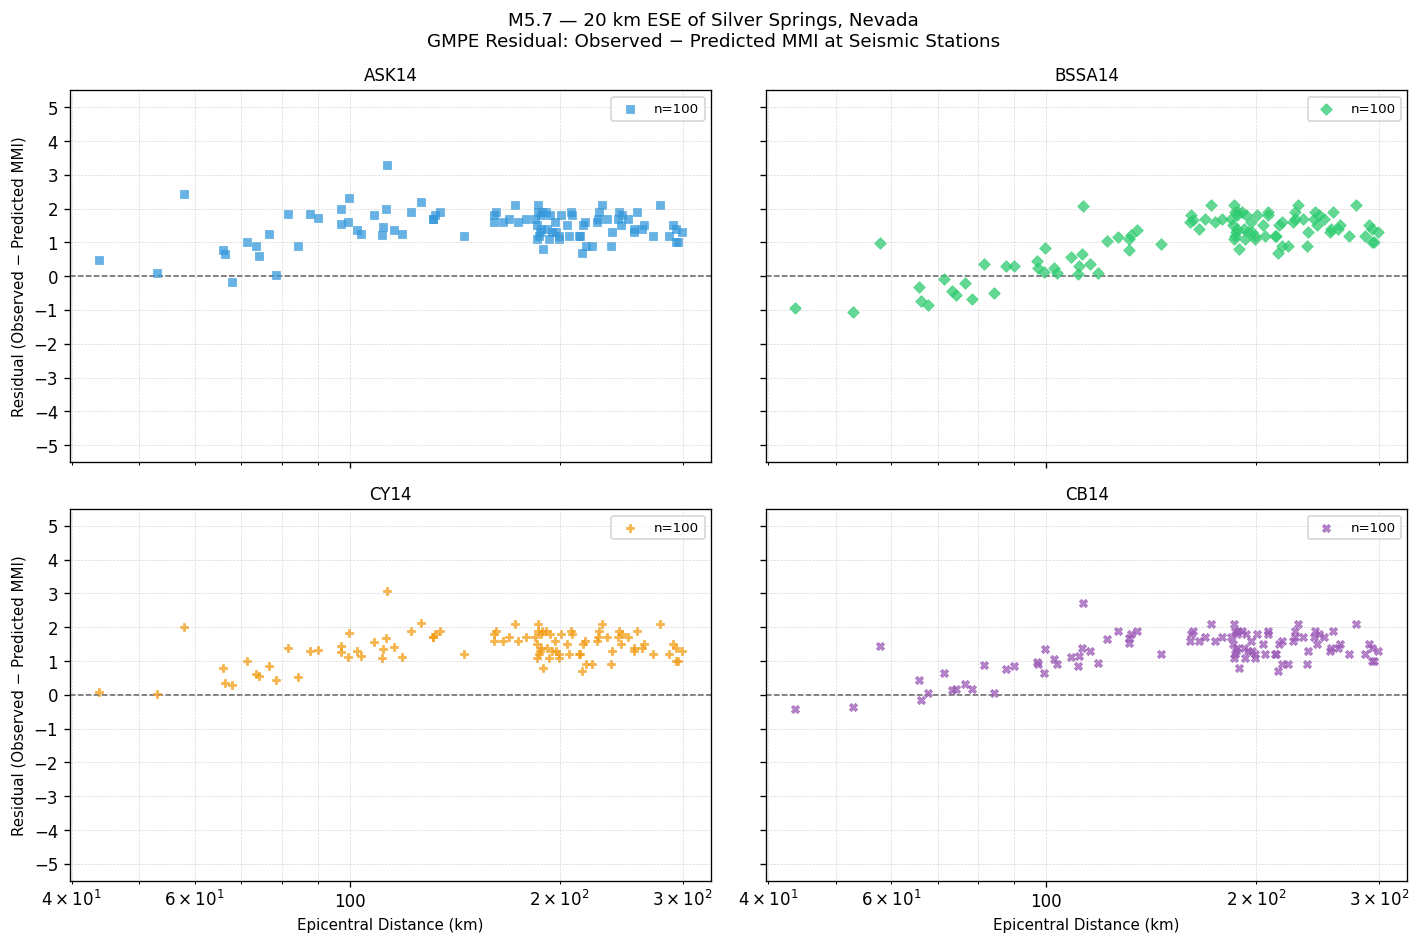
GMPE Residual — Observed − Predicted MMI
Signed residual at each seismic station. Positive values mean the GMPE underestimated shaking; negative values mean it overestimated. The dashed line at zero indicates perfect agreement.
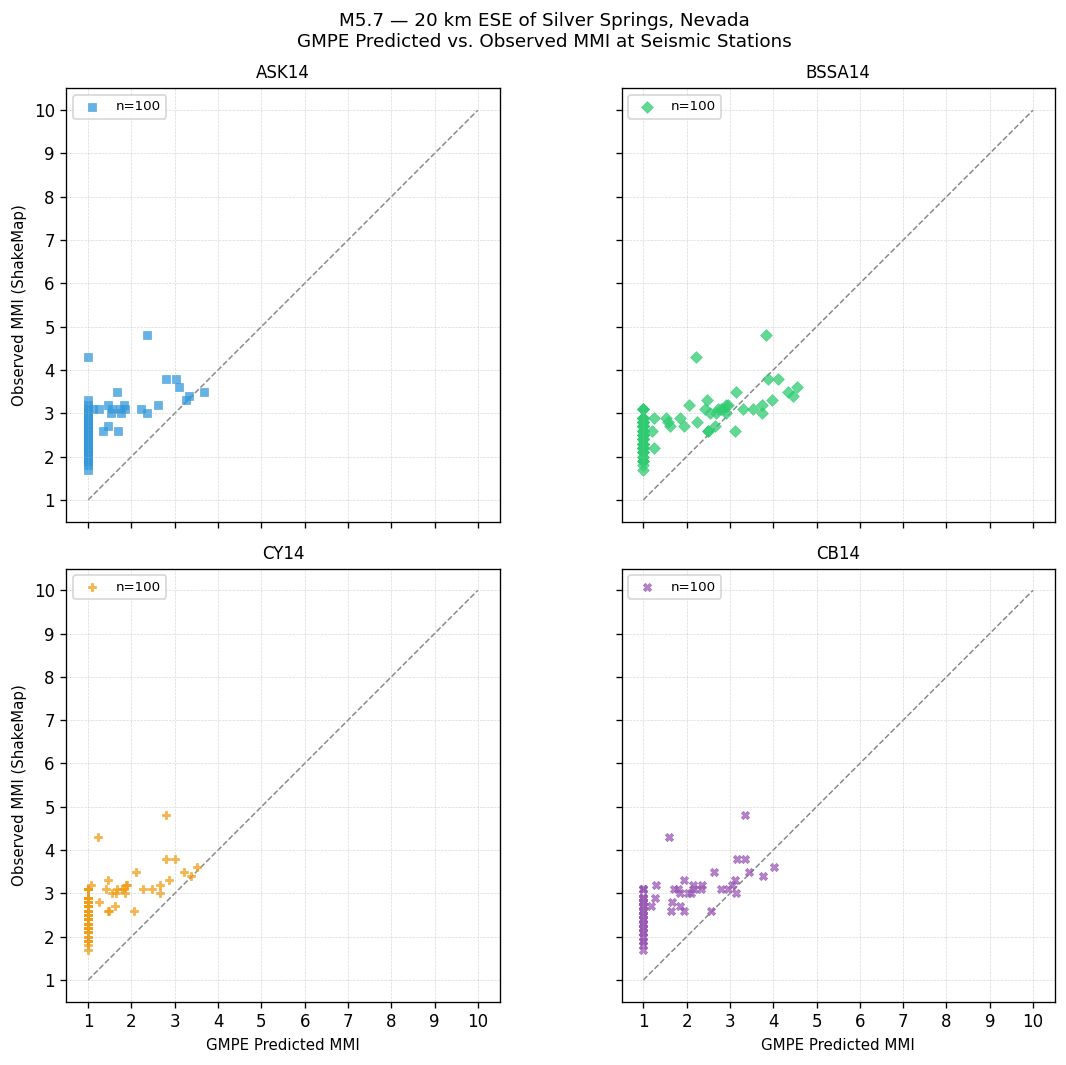
GMPE Predicted vs. Observed MMI at Seismic Stations
Each point is one seismic station. Points on the dashed 1:1 line indicate perfect agreement; above the line = GMPE underestimated shaking; below = overestimated.
GMPE Performance — Station Observations
Statistics computed by comparing each GMPE's predicted MMI against ShakeMap observed MMI at seismic stations. Bias = mean(observed − predicted). Lower RMSE indicates better overall agreement with instrumental measurements.
| GMPE | Bias | Sigma | RMSE |
|---|---|---|---|
| ASK14 | +1.47 | 0.51 | 1.55 |
| BSSA14 | +1.06 | 0.78 | 1.32 |
| CY14 | +1.41 | 0.49 | 1.49 |
| CB14 | +1.30 | 0.57 | 1.42 |
Peak Ground Motion — Seismic Station Observations
Recorded PGA and PGV at seismic stations, sorted by highest PGA. Top 25 stations shown. MMI (PGA) and MMI (PGV) are independent conversions via Worden et al. (2012) GMICE.
| Station | PGA (g) | MMI (PGA) | PGV (cm/s) | MMI (PGV) |
|---|---|---|---|---|
| Buffalo Canyon, Nevada w84gm (NN.BFC) | 0.0280 | Light(IV) | 1.224 | Light(IV) |
| Donner Summit, California (NN.DON) | 0.0206 | Weak(III) | 2.832 | Moderate(V) |
| Yerington, Nevada w84gm (NN.YER) | 0.0141 | Weak(II) | 0.892 | Light(IV) |
| Bishop Manogue Catholic High School, Reno, NV (NN.BMHS) | 0.0134 | Weak(II) | 1.189 | Light(IV) |
| Thunderbird Lodge, Lake Tahoe, NV (NN.TBRD) | 0.0131 | Weak(II) | 0.805 | Light(IV) |
| Queen Bee, Mono County, California (NN.QNBC) | 0.0091 | Weak(II) | 0.530 | Weak(III) |
| Nevada Energy (NP.2023) | 0.0083 | Weak(II) | 0.815 | Light(IV) |
| Meyers - South Lake Tahoe (CE.66038) | 0.0080 | Not felt(I) | 0.530 | Weak(III) |
| Pah Rah Range, Nevada w84gm (NN.PAH) | 0.0079 | Not felt(I) | 0.635 | Weak(III) |
| TV Hill 1, Hawthorne, NV (NN.TVH1) | 0.0073 | Not felt(I) | 0.562 | Weak(III) |
| Washoe Valley, Nevada;Laurence Kaplan Property (NN.WASH) | 0.0073 | Not felt(I) | 0.361 | Weak(III) |
| Bald Mtn, NV (NN.BALD) | 0.0070 | Not felt(I) | 0.442 | Weak(III) |
| Bunker Hill, Placer County, CA (NN.BUNK) | 0.0069 | Not felt(I) | 0.296 | Weak(III) |
| Zephyr Cove, Lake Tahoe, Nevada (NN.ZPR) | 0.0065 | Not felt(I) | 0.445 | Weak(III) |
| Highway Maintenance Yard (NP.2021) | 0.0064 | Not felt(I) | 0.286 | Weak(III) |
| Sage Hen site 5, Independence Lake, CA (NN.SAG5) | 0.0063 | Not felt(I) | 0.422 | Weak(III) |
| Pyramid Lake 2 (NN.PYM2) | 0.0061 | Not felt(I) | 0.380 | Weak(III) |
| Rockland Comm. Site (NN.RKLD) | 0.0059 | Not felt(I) | 0.437 | Weak(III) |
| Kaiserville, Nevada w84gm (NN.KVN) | 0.0056 | Not felt(I) | 0.204 | Weak(II) |
| Minden/Gardnerville Fire Stn RT130-ANSS w84gm (NN.MND1) | 0.0055 | Not felt(I) | 0.621 | Weak(III) |
| Sierra Vista (NC.MSVB) | 0.0052 | Not felt(I) | 0.174 | Weak(II) |
| Weber Reservoir, near Camino (BK.WEBR) | 0.0052 | Not felt(I) | 0.192 | Weak(II) |
| Weller Cave, Western Cave Conservancy, Sutter Creek, CA (BK.WELL) | 0.0051 | Not felt(I) | 0.242 | Weak(II) |
| Washoe County DEM, Nevada (NN.WDEM) | 0.0050 | Not felt(I) | 0.483 | Weak(III) |
| Verdi Peak, California (NN.VPK) | 0.0049 | Not felt(I) | 0.459 | Weak(III) |