Max Est. MMI
20 km W of Preston, Nevada
Shaking Animations
Simulated bowling pin shaking at each city’s intensity level. Videos appear as they finish rendering. The ground motion behind each video is under Ground Motion Records.
| Location | Type | Intensity at site | Animation | Ground motion |
|---|---|---|---|---|
| Decay: Las Vegas direction | Decay · Kitchen Simulated | Weak(III) USGS ShakeMap, 5 km site | Download Produced 2026-09-28T14:50:35.817713Z |
 Data files
|
| Decay: Las Vegas direction | Decay · Tabletop Simulated | Weak(III) USGS ShakeMap, 5 km site | Download Produced 2026-09-28T05:51:03.993758Z |
Data files
|
| Willow Creek Ranch, Ely, NV, USA - NN reactivation | Station · Tabletop Observed | Weak(II) station record | Download Produced 2026-09-28T06:37:07.230549Z | |
| Willow Creek Ranch, Ely, NV, USA - NN reactivation | Station · Kitchen Observed | Weak(II) station record | Download Produced 2026-09-28T23:46:16.983301Z | |
| Ely | City · Tabletop Simulated | Weak(II) USGS ShakeMap | Download Produced 2026-09-28T06:50:46.247439Z |
 Data files
|
| Ely | City · Kitchen Simulated | Weak(II) USGS ShakeMap |
Ground Motion Records
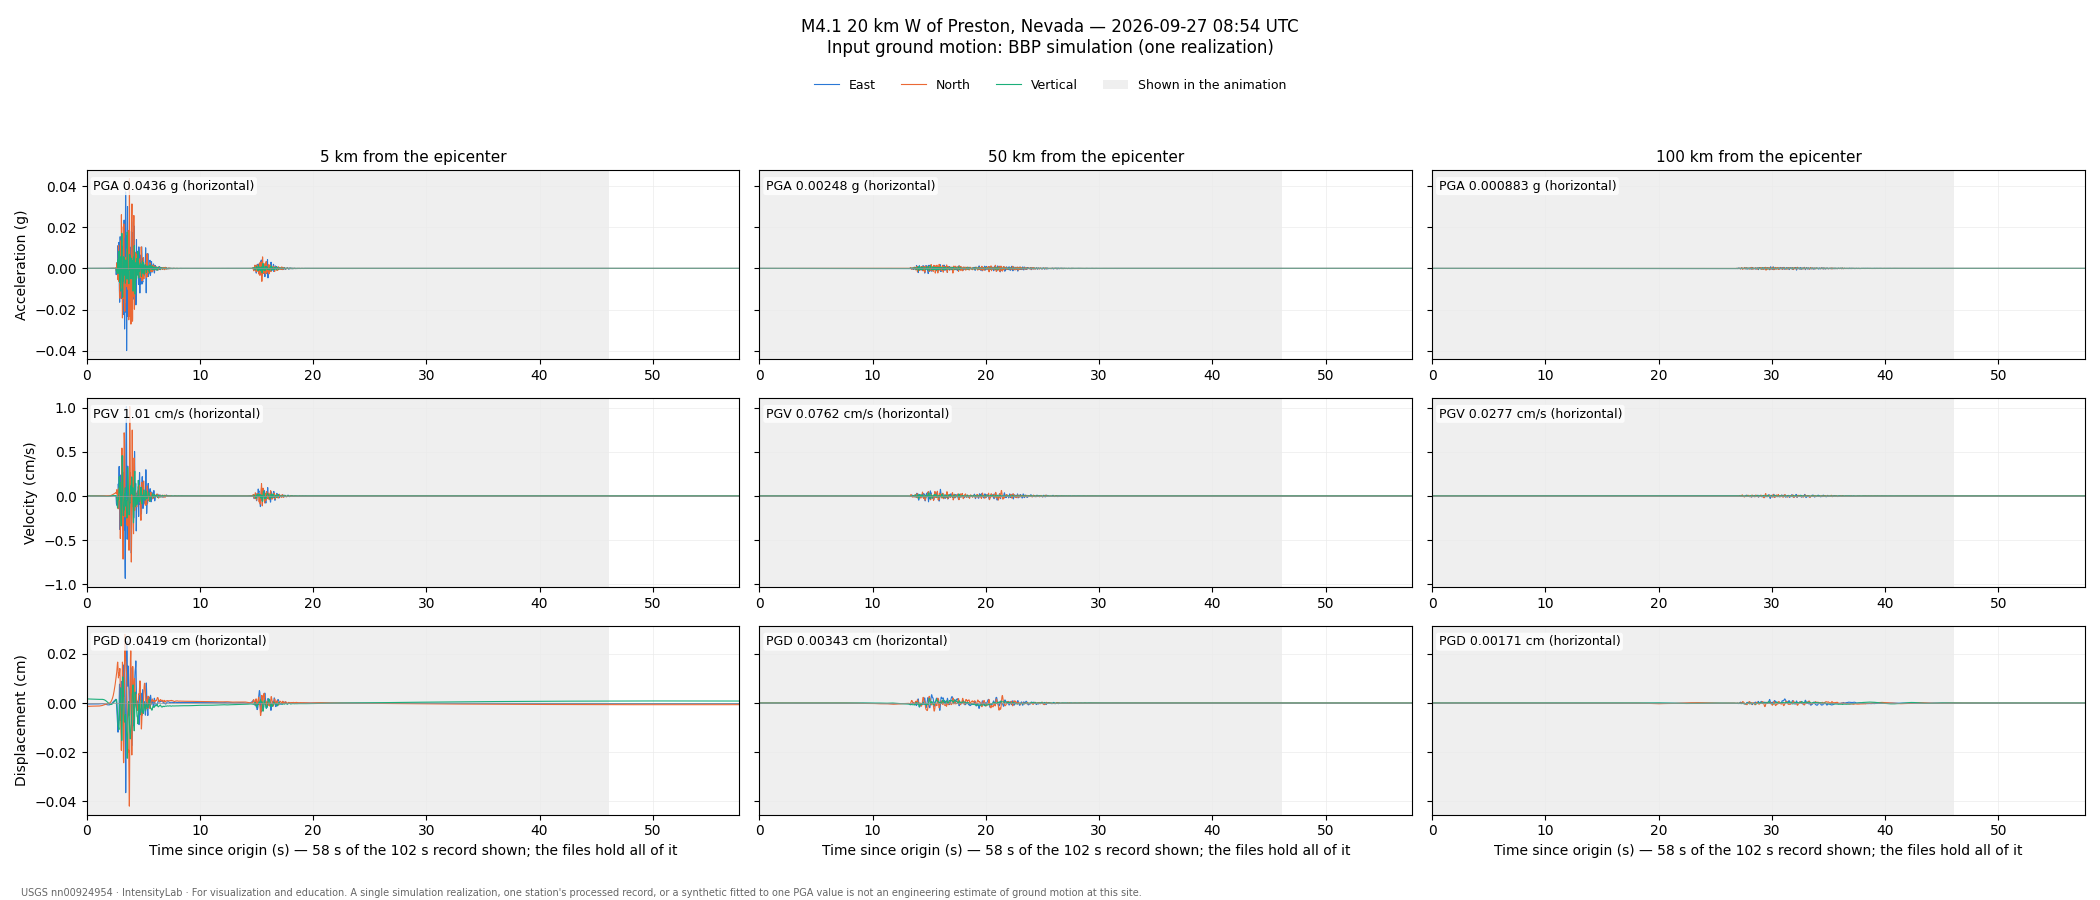
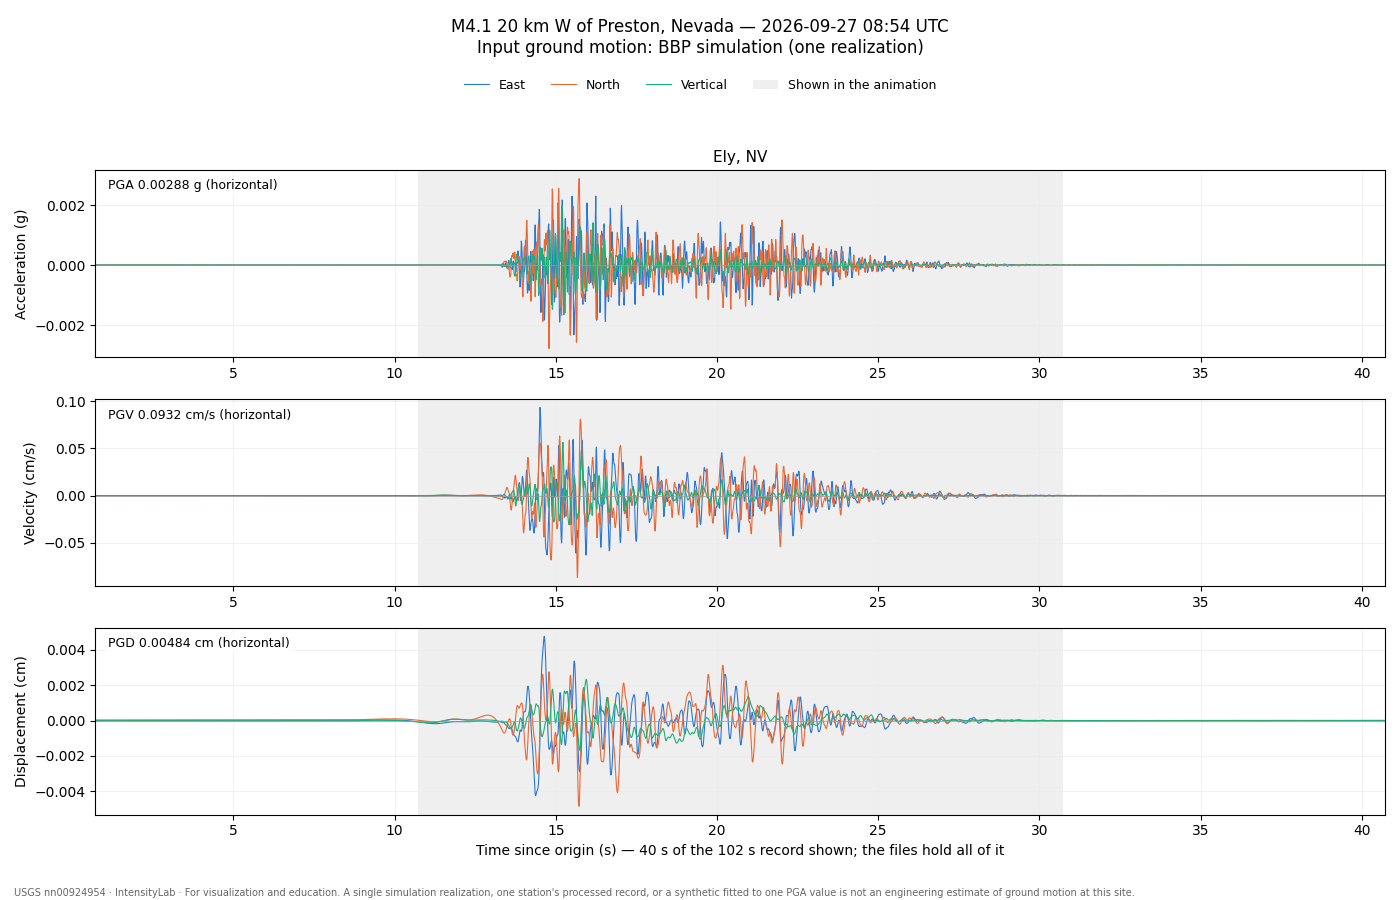
The shaking each animation was drawn from: acceleration, velocity and displacement in three directions. The shaded band marks the part the animation shows.
City · Simulated — Ely, NV
Used by the Tabletop videoA physics-based simulation of this earthquake (SCEC Broadband Platform) at this site: one realization, not an average.
| Site | PGA (g) | PGV (cm/s) | PGD (cm) | Data files |
|---|---|---|---|---|
| Ely, NV | 0.0029 | 0.09 | 0.00 | Acceleration · Velocity · Displacement |
Peak values are horizontal (the larger of north–south and east–west) over the whole record. Time zero: rupture origin time (simulation time 0).
Decay · Simulated — 5 km from the epicenter, 50 km from the epicenter, 100 km from the epicenter
Used by the Kitchen video and Tabletop videoA physics-based simulation of this earthquake (SCEC Broadband Platform) at this site: one realization, not an average.
| Site | PGA (g) | PGV (cm/s) | PGD (cm) | Data files |
|---|---|---|---|---|
| 5 km from the epicenter | 0.0436 | 1.01 | 0.04 | Acceleration · Velocity · Displacement |
| 50 km from the epicenter | 0.0025 | 0.08 | 0.00 | Acceleration · Velocity · Displacement |
| 100 km from the epicenter | 0.0009 | 0.03 | 0.00 | Acceleration · Velocity · Displacement |
Peak values are horizontal (the larger of north–south and east–west) over the whole record. Time zero: rupture origin time (simulation time 0).
About these files
Each file is plain text in the SCEC Broadband Platform layout. Lines starting with # are a header describing the earthquake, the site, where the motion came from, how it was processed, its peak values, and which part the animation shows. Then come four columns: time (s), north–south, east–west, and up–down. North–south comes before east–west.
Units: acceleration in cm/s², velocity in cm/s, displacement in cm. The zip also contains the plots and a README.
To read a file in Python: t, ns, ew, ud = numpy.loadtxt("file.acc.bbp", comments="#", unpack=True). A spreadsheet can open it as whitespace-delimited text.
These records explain what the animations show. A single simulation, one station’s record, or a synthetic scaled to one value is not an engineering estimate of ground motion at a site.
Engineering Ground Motion Parameters
GMPE predictions provide an independent check on the ShakeMap interpolated intensities above.
ShakeMap relies on seismic station recordings; in areas with sparse station coverage — or
for large teleseismic events and earthquakes outside dense West Coast networks — ShakeMap
MMI can be inaccurate. A significant difference between ShakeMap and GMPE estimates is a signal
that the ShakeMap result should be treated as preliminary.
Also includes site Vs30 values and raw ground motion parameters (PGA/PGV).
Show ▼
Engineering Ground Motion Parameters
GMPE predictions provide an independent check on the ShakeMap interpolated intensities above. ShakeMap relies on seismic station recordings; in areas with sparse station coverage — or for large teleseismic events and earthquakes outside dense West Coast networks — ShakeMap MMI can be inaccurate. A significant difference between ShakeMap and GMPE estimates is a signal that the ShakeMap result should be treated as preliminary. Also includes site Vs30 values and raw ground motion parameters (PGA/PGV).
Est. Vs30 Values
Estimated shear-wave velocity in the upper 30 m used in GMPE calculations. Ref. column shows the 760 m/s rock-site reference for comparison.
| Location | Ref. (760 m/s) | Est. Vs30 (m/s) |
|---|---|---|
|
Ely
NV |
760 | 569 |
|
McGill
NV |
760 | 533 |
|
Eureka
NV |
760 | 563 |
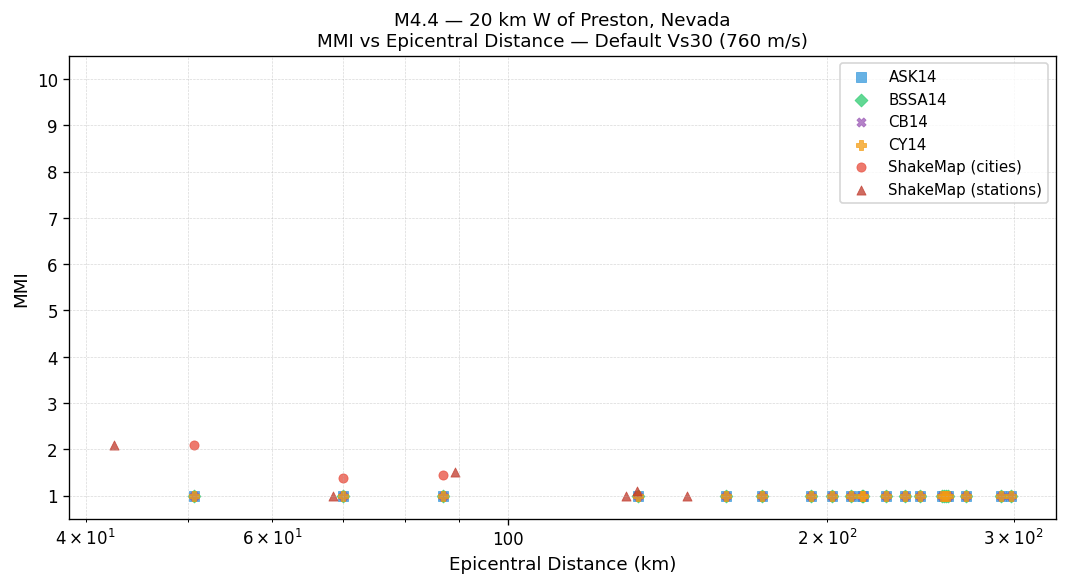
MMI vs Distance — Default Vs30 (760 m/s)
All methods using the 760 m/s rock-site reference. ShakeMap values are independent of Vs30.
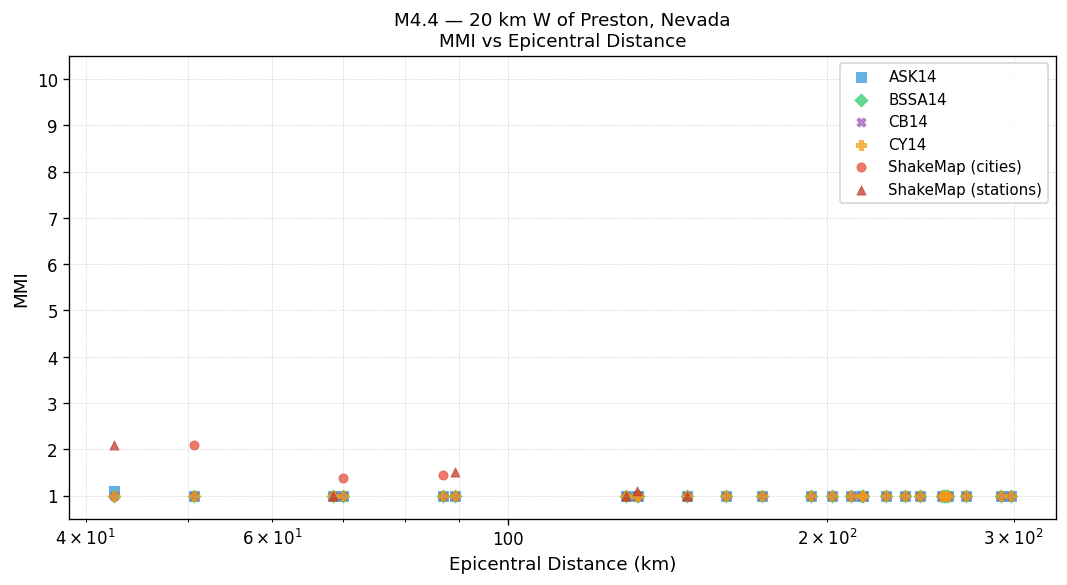
MMI vs Distance — Est. Vs30
GMPEs use the Est. Vs30 values shown in the table above. ShakeMap values are independent of Vs30.
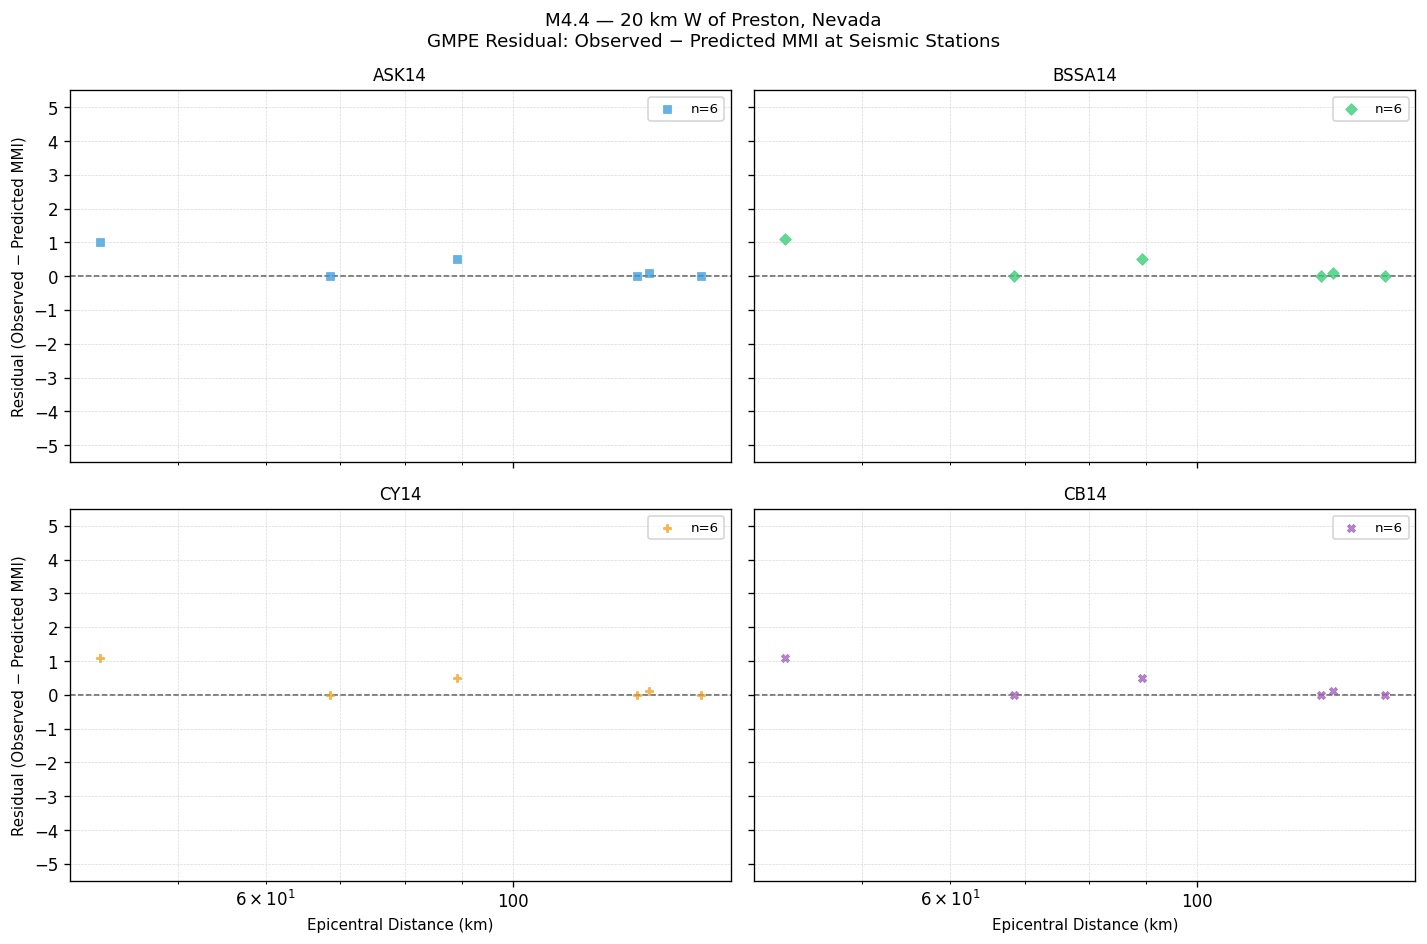
GMPE Residual — Observed − Predicted MMI
Signed residual at each seismic station. Positive values mean the GMPE underestimated shaking; negative values mean it overestimated. The dashed line at zero indicates perfect agreement.
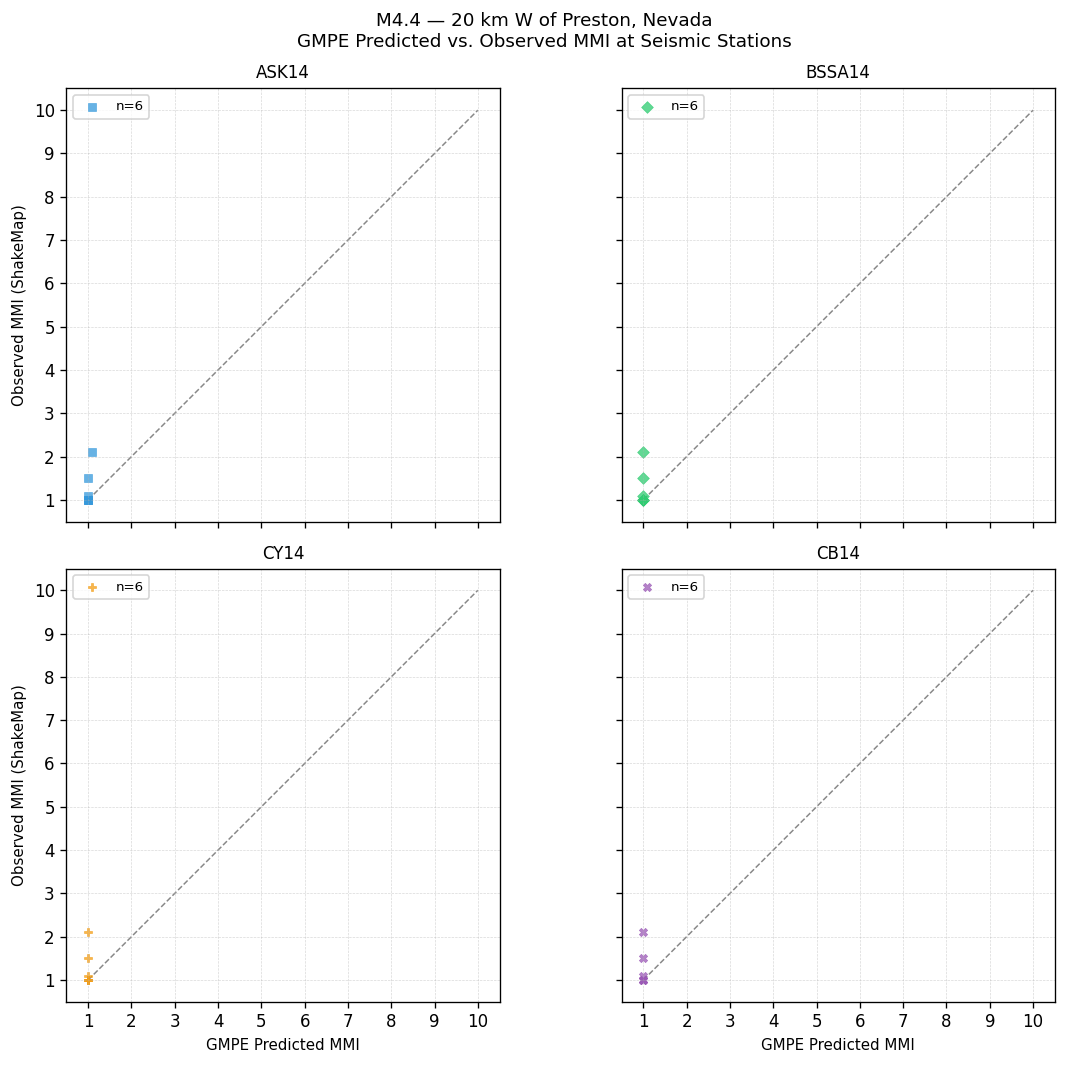
GMPE Predicted vs. Observed MMI at Seismic Stations
Each point is one seismic station. Points on the dashed 1:1 line indicate perfect agreement; above the line = GMPE underestimated shaking; below = overestimated.
GMPE Performance — Station Observations
Statistics computed by comparing each GMPE's predicted MMI against ShakeMap observed MMI at seismic stations. Bias = mean(observed − predicted). Lower RMSE indicates better overall agreement with instrumental measurements.
| GMPE | Bias | Sigma | RMSE |
|---|---|---|---|
| ASK14 | +0.28 | 0.44 | 0.49 |
| BSSA14 | +0.28 | 0.44 | 0.49 |
| CY14 | +0.28 | 0.44 | 0.49 |
| CB14 | +0.28 | 0.44 | 0.49 |
Peak Ground Motion — Seismic Station Observations
Recorded PGA and PGV at seismic stations, sorted by highest PGA. Top 25 stations shown. MMI (PGA) and MMI (PGV) are independent conversions via Worden et al. (2012) GMICE.
| Station | PGA (g) | MMI (PGA) | PGV (cm/s) | MMI (PGV) |
|---|---|---|---|---|
| Willow Creek Ranch, Ely, NV, USA - NN reactivation (NN.Q12A) | 0.0026 | Not felt(I) | 0.057 | Not felt(I) |
| Pony Springs, Pioche, NV, USA (NN.R12A) | 0.0011 | Not felt(I) | 0.032 | Not felt(I) |
| Pine Springs, UT (UU.PSUT) | 0.0005 | Not felt(I) | 0.021 | Not felt(I) |
| Rachel, NV, USA - NN reactivation (NN.S11A) | 0.0004 | Not felt(I) | 0.018 | Not felt(I) |
| Troy Canyon, Currant, NV, USA (NN.R11B) | 0.0003 | Not felt(I) | — | — |
| Pioche, NV, USA - NN reactivation (NN.PIO) | 0.0003 | Not felt(I) | 0.010 | Not felt(I) |
Ground Shaking Intensities — Interpolated ShakeMap MMI
3 sites| Location | MMI Description |
|---|---|
|
Ely
NV |
Weak(II) |
|
McGill
NV |
Not felt(I) |
|
Eureka
NV |
Not felt(I) |
Seismic Station Observed MMI
MMI values are derived directly from observed ground motion measurements at seismic stations and are not spatially interpolated.
| Station | MMI Description |
|---|---|
| Willow Creek Ranch, Ely, NV, USA - NN reactivation (NN.Q12A) | Weak(II) |
| Troy Canyon, Currant, NV, USA (NN.R11B) | Not felt(I) |
| Pony Springs, Pioche, NV, USA (NN.R12A) | Not felt(I) |