How the Wave Simulations Work
The method behind the regional earthquake wave simulations, what they have been checked against, and their limits.
How the movies are made
We run SW4, a seismic wave simulation code from Lawrence Livermore National Laboratory, through the bbpservices.net API, the same service that provides our BBP simulations. SW4 starts from the same earthquake source as the BBP simulation of that earthquake: the fault plane, its size and the way slip spreads across it.
BBP returns a seismogram at each chosen place. SW4 computes the motion across the whole surface of a region about 100 to 250 km across, on a 200 m grid, and that wavefield is what the movies show. Each movie colors the ground velocity at every point, second by second, draws six simulated seismograms at their stations, and ends on the peak ground velocity map.
The model of the crust
Where a 3D community velocity model covers the region, the simulation uses it through SCEC UCVM: in southern California, CVM-S4.26 with the Ely-Jordan geotechnical layer; in northern California, the SFCVM. A 3D model holds the sedimentary basins, so the movies show waves slowed, trapped and amplified in them. Where no 3D model covers the event, or a 3D run fails, the simulation uses the layered (1D) crust that BBP uses. Every movie and event page names the model the run actually used.
The model is limited to shear wave speeds of 500 m/s and above, which is what lets a 200 m grid carry waves up to 0.5 Hz.
SW4 and BBP agree at the same sites
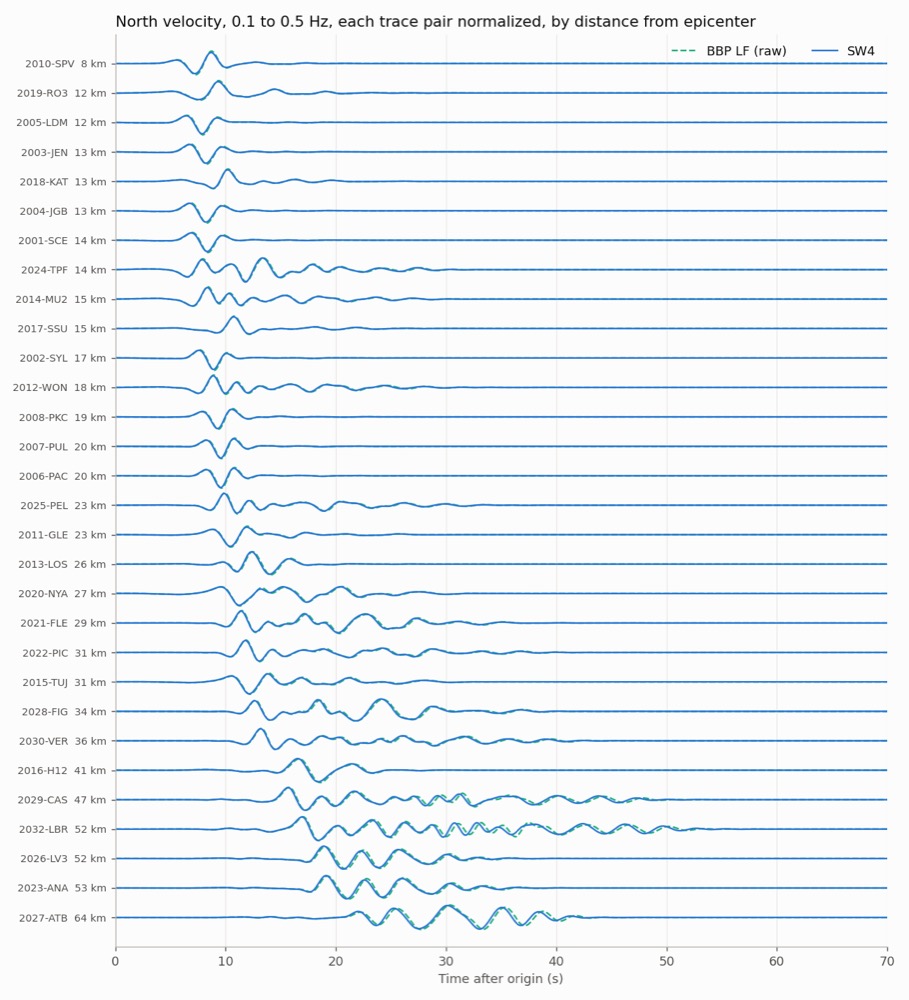
With the same layered model, the two codes should compute the same low-frequency motion. For eight validation earthquakes, the median correlation between SW4 and BBP low-frequency seismograms at stations within 20 km ranged from 0.989 to 0.998, in the band from 0.1 to 0.5 Hz.
Simulated and recorded peak ground velocity
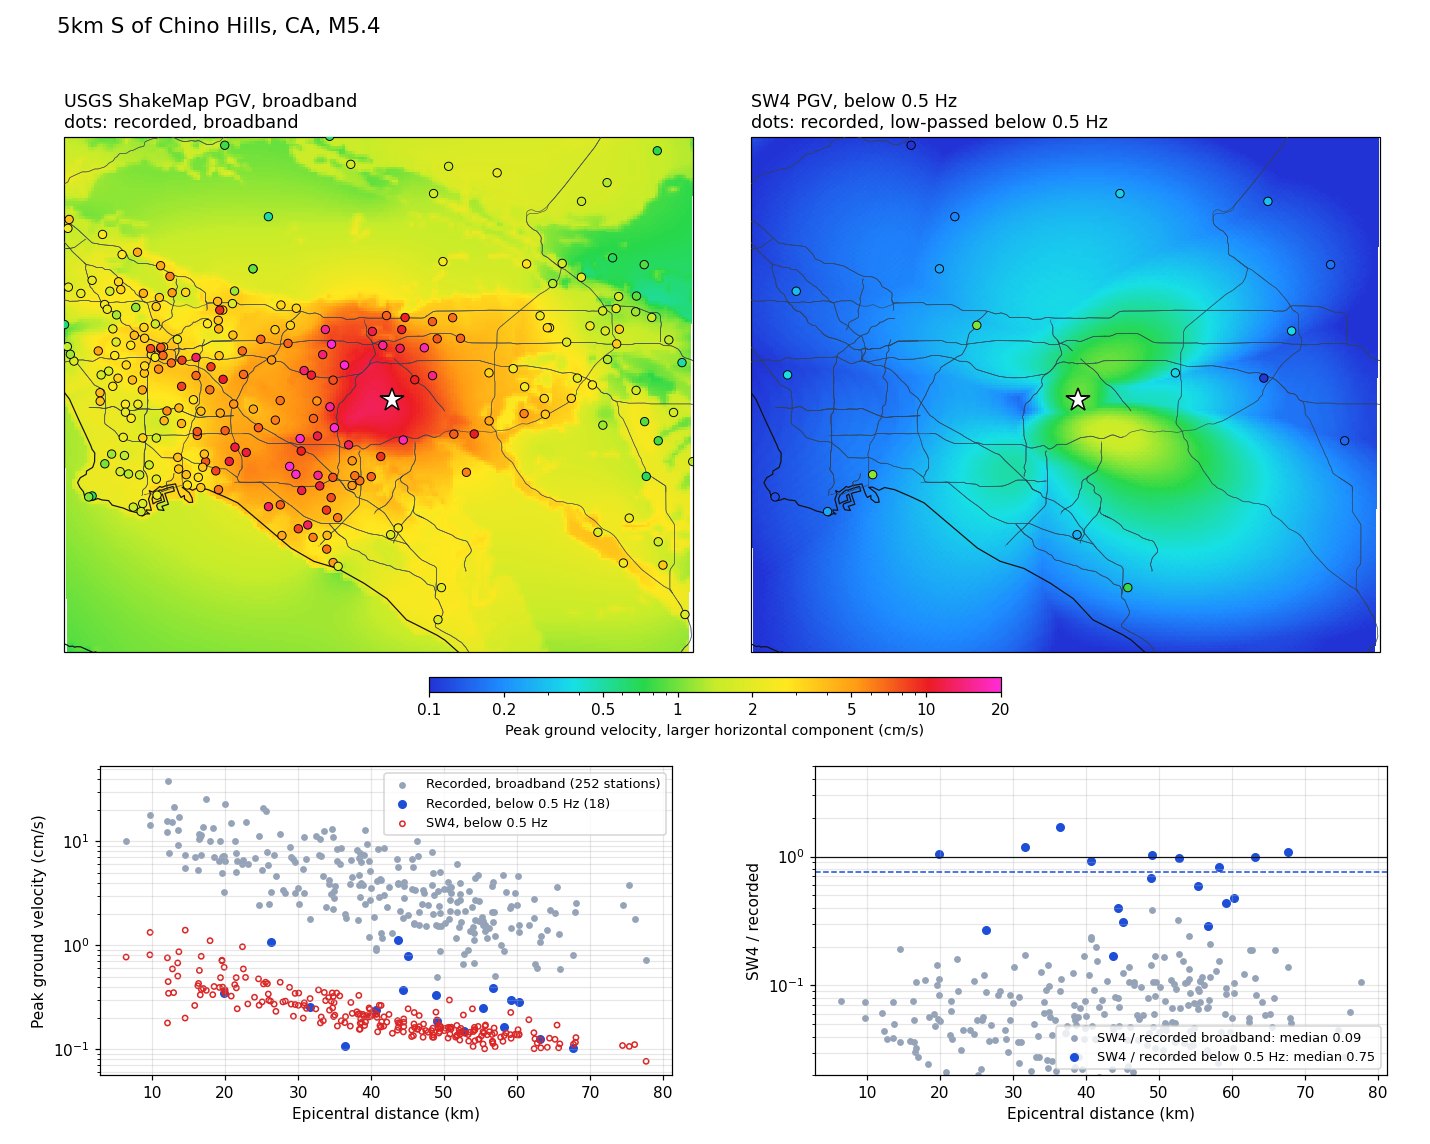
Each movie ends on a peak ground velocity map. Set beside USGS ShakeMap, it reads about ten times lower, but most of that gap is the frequency band, not the simulation. ShakeMap’s values are broadband, while the simulation holds only waves below 0.5 Hz. To compare like with like, we filter the recordings the same way.
For the 2008 Chino Hills earthquake, simulated with the layered model, waves below 0.5 Hz carry about 19% of the recorded peak velocity. In that band the simulation reads 0.75 of the recorded peak, the median over 18 stations, with two thirds of them between 0.3 and 1.05. It reads lowest at basin sites, such as downtown Los Angeles and La Cienega, and close to the recordings at mountain rock sites such as Mount Wilson and Chilao Flat. A model without sedimentary basins should behave that way, which is why production simulations now use the 3D models where they exist.
Every event page with these movies shows the same comparison for that earthquake, below its peak ground velocity map.
What these movies do not show
The surface is flat, so there is no terrain. The simulation holds waves below 0.5 Hz only, and the colors are ground velocity at that low frequency. A movie made with the layered crust has no basin amplification. Each movie ends on a peak ground velocity map that uses the USGS ShakeMap definition, the larger horizontal component, but holds only these low frequencies, so it reads lower than ShakeMap’s broadband values (see above). Nothing is converted to intensity.