Max Est. MMI
M5.4 earthquake · shaking intensity by town 5km S of Chino Hills, CA
Shaking Animations
Simulated bowling pin shaking at each city’s intensity level. Videos appear as they finish rendering. The ground motion behind each video is under Ground Motion Records.
| Location | Type | Intensity at site | Animation | Ground motion |
|---|---|---|---|---|
| Decay: San Diego direction | Decay · Tabletop Simulated | Strong(VI) USGS ShakeMap, 5 km site | Download Produced 2026-11-09T10:03:59.577292Z |
 Data files |
| Decay: San Diego direction | Decay · Kitchen Simulated | Strong(VI) USGS ShakeMap, 5 km site | Download Produced 2026-11-09T09:29:37.663806Z |
Data files
|
| Chino Hills | City · Kitchen Simulated | Moderate(V) USGS ShakeMap | Download Produced 2026-11-09T09:44:31.396717Z |
 Data files |
| Chino Hills | City · Tabletop Simulated | Moderate(V) USGS ShakeMap | Download Produced 2026-11-09T10:16:12.148007Z |
Data files
|
Seismic Waves Across the Region
A simulation of this earthquake’s waves crossing the region (SW4, through the bbpservices.net API): ground velocity at the surface, moment by moment. The model is a layered 1D crust with a flat surface, so it shows no basin amplification or terrain effects, and it holds waves below 0.5 Hz only. The colours are not broadband peak ground velocity and are not converted to intensity.
Ground Motion Records
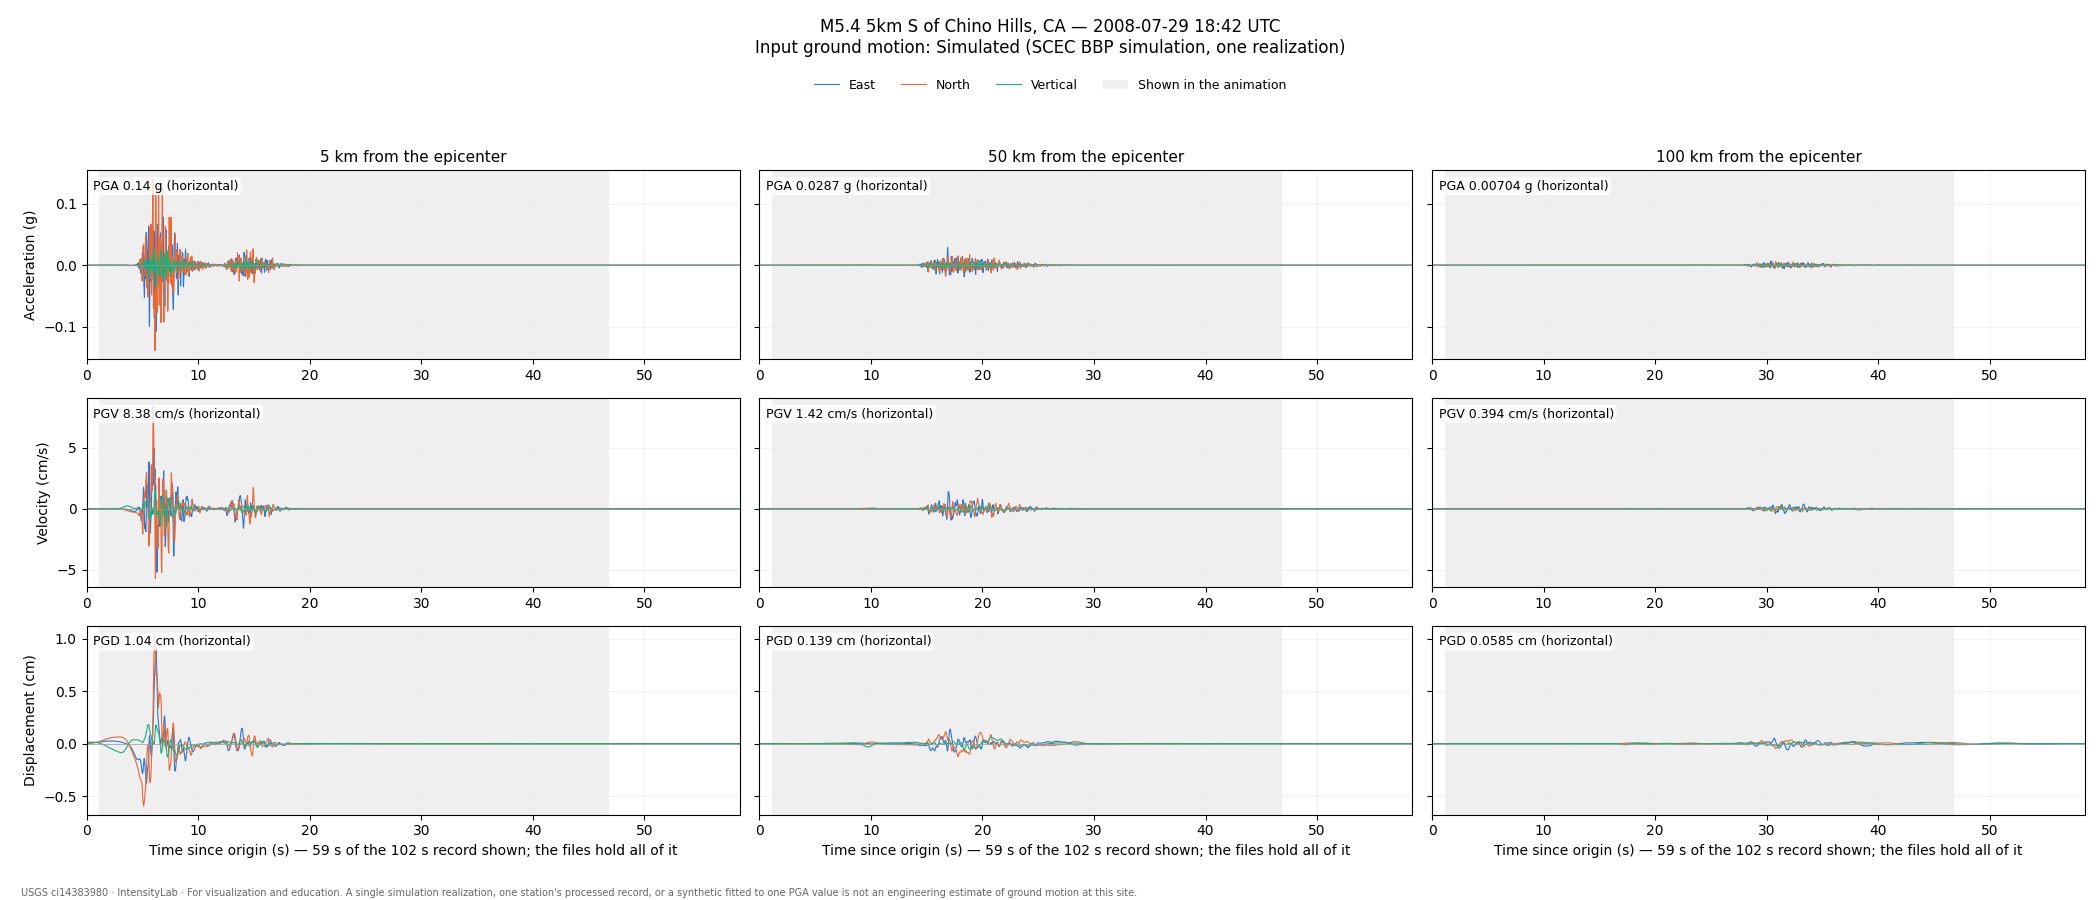
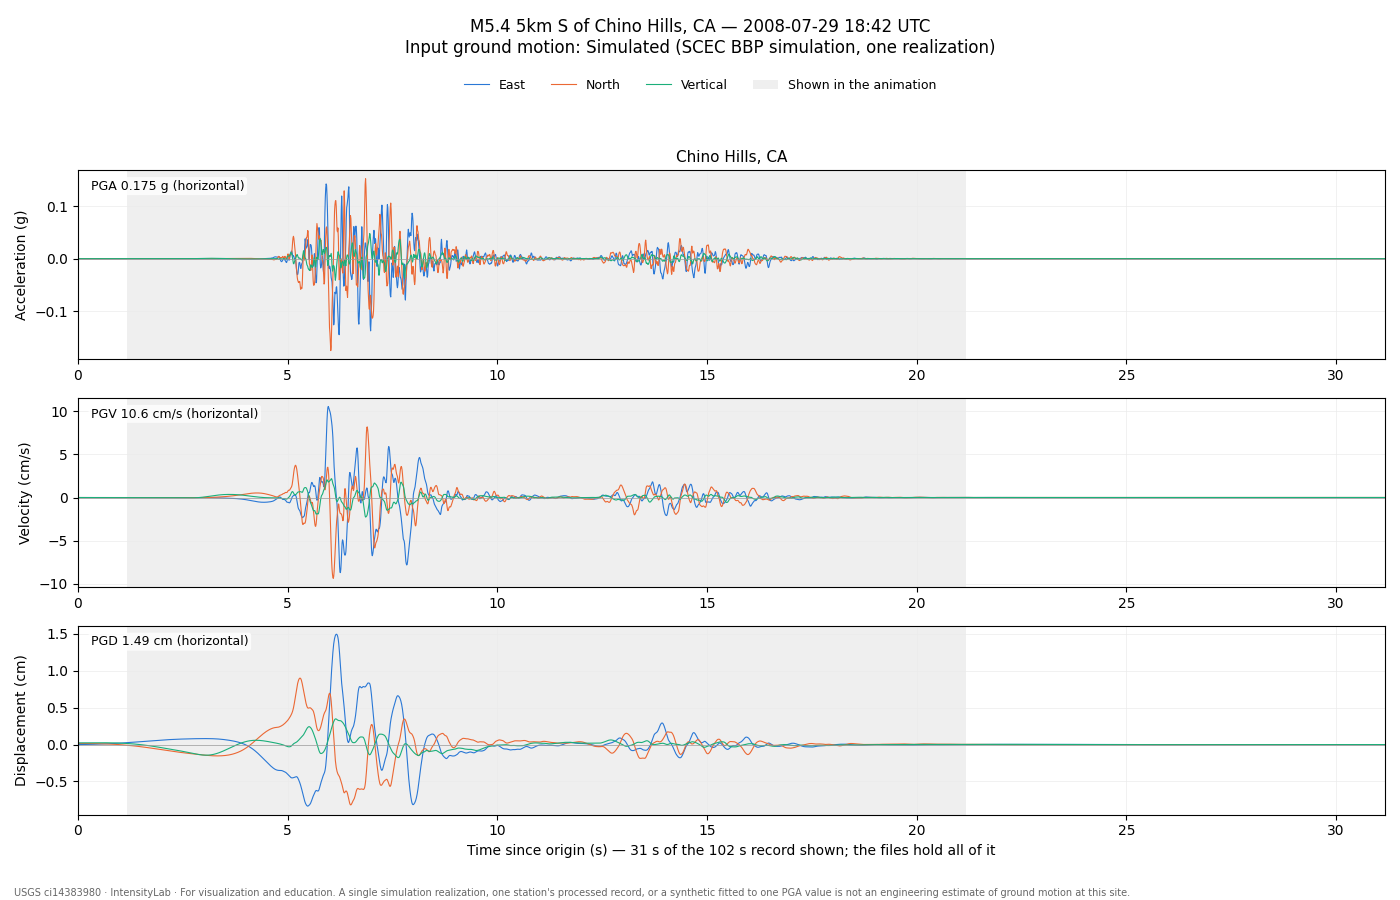
The shaking each animation was drawn from: acceleration, velocity and displacement in three directions. The shaded band marks the part the animation shows.
City · Simulated: Chino Hills, CA
Used by the Kitchen video and Tabletop videoA physics-based simulation of this earthquake (SCEC Broadband Platform) at this site: one realization, not an average.
| Site | PGA (g) | PGV (cm/s) | PGD (cm) | Data files |
|---|---|---|---|---|
| Chino Hills, CA | 0.1746 | 10.55 | 1.49 | Acceleration · Velocity · Displacement |
Peak values are horizontal (the larger of north–south and east–west) over the whole record. Time zero: rupture origin time (simulation time 0).
Decay · Simulated: 5 km from the epicenter, 50 km from the epicenter, 100 km from the epicenter
Used by the Kitchen video and Tabletop videoA physics-based simulation of this earthquake (SCEC Broadband Platform) at this site: one realization, not an average.
| Site | PGA (g) | PGV (cm/s) | PGD (cm) | Data files |
|---|---|---|---|---|
| 5 km from the epicenter | 0.1402 | 8.38 | 1.04 | Acceleration · Velocity · Displacement |
| 50 km from the epicenter | 0.0287 | 1.42 | 0.14 | Acceleration · Velocity · Displacement |
| 100 km from the epicenter | 0.0070 | 0.39 | 0.06 | Acceleration · Velocity · Displacement |
Peak values are horizontal (the larger of north–south and east–west) over the whole record. Time zero: rupture origin time (simulation time 0).
About these files
Each file is plain text in the SCEC Broadband Platform layout. Lines starting with # are a header describing the earthquake, the site, where the motion came from, how it was processed, its peak values, and which part the animation shows. Then come four columns: time (s), north–south, east–west, and up–down. North–south comes before east–west.
Units: acceleration in cm/s², velocity in cm/s, displacement in cm. The zip also contains the plots and a README.
To read a file in Python: t, ns, ew, ud = numpy.loadtxt("file.acc.bbp", comments="#", unpack=True). A spreadsheet can open it as whitespace-delimited text.
These records explain what the animations show. A single simulation, one station’s record, or a synthetic scaled to one value is not an engineering estimate of ground motion at a site.
Engineering Ground Motion Parameters
GMPE predictions provide an independent check on the ShakeMap interpolated intensities above.
ShakeMap relies on seismic station recordings; in areas with sparse station coverage (or
for large teleseismic events and earthquakes outside dense West Coast networks), ShakeMap
MMI can be inaccurate. A significant difference between ShakeMap and GMPE estimates is a signal
that the ShakeMap result should be treated as preliminary.
Also includes site Vs30 values and raw ground motion parameters (PGA/PGV).
Show ▼
Engineering Ground Motion Parameters
GMPE predictions provide an independent check on the ShakeMap interpolated intensities above. ShakeMap relies on seismic station recordings; in areas with sparse station coverage (or for large teleseismic events and earthquakes outside dense West Coast networks), ShakeMap MMI can be inaccurate. A significant difference between ShakeMap and GMPE estimates is a signal that the ShakeMap result should be treated as preliminary. Also includes site Vs30 values and raw ground motion parameters (PGA/PGV).
Est. Vs30 Values
Estimated shear-wave velocity in the upper 30 m used in GMPE calculations. Ref. column shows the 760 m/s rock-site reference for comparison.
| Location | Ref. (760 m/s) | Est. Vs30 (m/s) |
|---|---|---|
|
Diamond Bar
CA |
760 | 355 |
|
Yorba Linda
CA |
760 | 387 |
|
Walnut
CA |
760 | 373 |
|
Chino Hills
CA |
760 | 393 |
|
Covina
CA |
760 | 297 |
|
Charter Oak
CA |
760 | 294 |
|
Los Serranos
CA |
760 | 385 |
|
Brea
CA |
760 | 218 |
|
Pomona
CA |
760 | 294 |
|
Fullerton
CA |
760 | 294 |
|
Citrus
CA |
760 | 295 |
|
Placentia
CA |
760 | 352 |
|
La Verne
CA |
760 | 308 |
|
Los Alamitos
CA |
760 | 221 |
|
San Dimas
CA |
760 | 380 |
|
Whittier
CA |
760 | 330 |
|
Buena Park
CA |
760 | 228 |
|
Anaheim
CA |
760 | 229 |
|
Chino
CA |
760 | 294 |
|
Glendora
CA |
760 | 353 |
|
South San Jose Hills
CA |
760 | 312 |
|
Stanton
CA |
760 | 230 |
|
Montclair
CA |
760 | 348 |
|
Artesia
CA |
760 | 230 |
|
Garden Grove
CA |
760 | 228 |
|
West Covina
CA |
760 | 304 |
|
Hacienda Heights
CA |
760 | 359 |
|
Rowland Heights
CA |
760 | 338 |
|
La Habra Heights
CA |
760 | 451 |
|
East La Mirada
CA |
760 | 365 |
|
La Habra
CA |
760 | 364 |
|
Rossmoor
CA |
760 | 220 |
|
Valinda
CA |
760 | 296 |
|
Midway City
CA |
760 | 228 |
|
Avocado Heights
CA |
760 | 374 |
|
Cypress
CA |
760 | 262 |
|
La Puente
CA |
760 | 398 |
|
South Whittier
CA |
760 | 293 |
|
Hawaiian Gardens
CA |
760 | 228 |
|
South El Monte
CA |
760 | 233 |
|
Vincent
CA |
760 | 301 |
|
Westminster
CA |
760 | 229 |
|
Azusa
CA |
760 | 296 |
|
Cerritos
CA |
760 | 229 |
|
Lakewood
CA |
760 | 229 |
|
West Puente Valley
CA |
760 | 268 |
|
West Whittier-Los Nietos
CA |
760 | 224 |
|
La Mirada
CA |
760 | 375 |
|
Norwalk
CA |
760 | 234 |
|
Ontario
CA |
760 | 294 |
|
El Monte
CA |
760 | 282 |
|
Bellflower
CA |
760 | 231 |
|
Home Gardens
CA |
760 | 374 |
|
Fountain Valley
CA |
760 | 219 |
|
La Palma
CA |
760 | 228 |
|
Norco
CA |
760 | 375 |
|
North Tustin
CA |
760 | 400 |
|
Claremont
CA |
760 | 352 |
|
Pico Rivera
CA |
760 | 223 |
|
Commerce
CA |
760 | 253 |
|
Corona
CA |
760 | 352 |
|
Downey
CA |
760 | 232 |
|
Santa Ana
CA |
760 | 237 |
|
Canyon Lake
CA |
760 | 301 |
|
Northwood
CA |
760 | 293 |
|
Jurupa Valley
CA |
760 | 360 |
|
Paramount
CA |
760 | 233 |
|
Baldwin Park
CA |
760 | 305 |
|
East Los Angeles
CA |
760 | 382 |
|
Eastvale
CA |
760 | 356 |
|
Montebello
CA |
760 | 375 |
|
Irwindale
CA |
760 | 298 |
|
Orange
CA |
760 | 363 |
|
East San Gabriel
CA |
760 | 396 |
|
Pedley
CA |
760 | 387 |
|
Rosemead
CA |
760 | 294 |
|
Santa Fe Springs
CA |
760 | 267 |
|
Tustin
CA |
760 | 287 |
|
Sedco Hills
CA |
760 | 322 |
|
Upland
CA |
760 | 352 |
|
South San Gabriel
CA |
760 | 398 |
|
Winnetka
CA |
760 | 291 |
|
Alhambra
CA |
760 | 392 |
|
Maywood
CA |
760 | 233 |
|
Calabasas
CA |
760 | 293 |
|
Belvedere
CA |
760 | 391 |
|
Canoga Park
CA |
760 | 279 |
|
Glen Avon
CA |
760 | 386 |
|
Bell
CA |
760 | 231 |
|
Cudahy
CA |
760 | 231 |
|
El Cerrito Corona
CA |
760 | 380 |
|
San Gabriel
CA |
760 | 393 |
|
Seal Beach
CA |
760 | 359 |
|
Temple City
CA |
760 | 291 |
|
Boyle Heights
CA |
760 | 366 |
|
Rancho Cucamonga
CA |
760 | 352 |
|
Huntington Park
CA |
760 | 295 |
|
Riverside
CA |
760 | 364 |
|
Villa Park
CA |
760 | 331 |
|
Woodland Hills
CA |
760 | 282 |
|
North El Monte
CA |
760 | 307 |
|
West Hills
CA |
760 | 426 |
|
East Pasadena
CA |
760 | 343 |
|
Los Angeles
CA |
760 | 355 |
|
Northridge
CA |
760 | 293 |
|
Pasadena
CA |
760 | 436 |
|
San Antonio Heights
CA |
760 | 352 |
|
Bell Gardens
CA |
760 | 239 |
|
La Crescenta-Montrose
CA |
760 | 441 |
|
Stonegate
CA |
760 | 293 |
|
Monterey Park
CA |
760 | 382 |
|
Reseda
CA |
760 | 226 |
|
Florence-Graham
CA |
760 | 229 |
|
Hidden Hills
CA |
760 | 399 |
|
Koreatown
CA |
760 | 322 |
|
Lynwood
CA |
760 | 229 |
|
Mayflower Village
CA |
760 | 302 |
|
Meadowbrook
CA |
760 | 710 |
|
Muscoy
CA |
760 | 317 |
|
San Marino
CA |
760 | 399 |
|
South Gate
CA |
760 | 293 |
|
South Pasadena
CA |
760 | 403 |
|
Walnut Park
CA |
760 | 294 |
|
Wildomar
CA |
760 | 352 |
|
East Rancho Dominguez
CA |
760 | 232 |
|
Woodcrest
CA |
760 | 710 |
|
Bradbury
CA |
760 | 382 |
|
El Camino Real
CA |
760 | 293 |
|
Hollywood
CA |
760 | 458 |
|
Walnut Village
CA |
760 | 292 |
|
Laguna Hills
CA |
760 | 359 |
|
Newport Beach
CA |
760 | 279 |
|
Sunnyslope
CA |
760 | 394 |
|
Huntington Beach
CA |
760 | 255 |
|
Arcadia
CA |
760 | 310 |
|
Costa Mesa
CA |
760 | 321 |
|
Monrovia
CA |
760 | 354 |
|
Murrieta
CA |
760 | 294 |
|
Duarte
CA |
760 | 355 |
|
Lakeland Village
CA |
760 | 357 |
|
Mid-City
CA |
760 | 282 |
|
Rubidoux
CA |
760 | 294 |
|
Laguna Woods
CA |
760 | 392 |
|
Larchmont
CA |
760 | 401 |
|
Studio City
CA |
760 | 281 |
|
Long Beach
CA |
760 | 255 |
|
Burbank
CA |
760 | 377 |
|
Canyon Country
CA |
760 | 293 |
|
Sierra Madre
CA |
760 | 424 |
|
Compton
CA |
760 | 243 |
|
Cypress Village
CA |
760 | 293 |
|
Quail Valley
CA |
760 | 465 |
|
Sherman Oaks
CA |
760 | 289 |
|
Tustin Legacy
CA |
760 | 227 |
|
Altadena
CA |
760 | 466 |
|
Encino
CA |
760 | 348 |
|
San Bernardino
CA |
760 | 301 |
|
Silver Lake
CA |
760 | 351 |
|
Sun City
CA |
760 | 365 |
|
Lake Forest
CA |
760 | 361 |
|
Mission Viejo
CA |
760 | 468 |
|
Mead Valley
CA |
760 | 378 |
|
Lake Elsinore
CA |
760 | 455 |
|
Willowbrook
CA |
760 | 302 |
|
North Hollywood
CA |
760 | 297 |
|
Rialto
CA |
760 | 381 |
|
Chatsworth
CA |
760 | 294 |
|
Stevenson Ranch
CA |
760 | 397 |
|
Vermont Square
CA |
760 | 233 |
|
Westpark
CA |
760 | 293 |
|
Bloomington
CA |
760 | 299 |
|
Echo Park
CA |
760 | 357 |
|
Fontana
CA |
760 | 294 |
|
Laguna Beach
CA |
760 | 352 |
|
Moreno Valley
CA |
760 | 384 |
|
Portola Hills
CA |
760 | 468 |
|
Colton
CA |
760 | 292 |
|
Loma Linda
CA |
760 | 350 |
|
San Joaquin Hills
CA |
760 | 385 |
|
Tujunga
CA |
760 | 352 |
|
Irvine Health and Science Complex
CA |
760 | 293 |
|
North Hills
CA |
760 | 306 |
|
Valley Glen
CA |
760 | 310 |
|
Irvine
CA |
760 | 293 |
|
Trabuco Canyon
CA |
760 | 373 |
|
Van Nuys
CA |
760 | 292 |
|
Wrightwood
CA |
760 | 478 |
|
West Carson
CA |
760 | 287 |
|
Beverly Hills
CA |
760 | 294 |
|
Hemet
CA |
760 | 293 |
|
University Town Center
CA |
760 | 381 |
|
Glendale
CA |
760 | 378 |
|
Highgrove
CA |
760 | 357 |
|
Santa Clarita
CA |
760 | 289 |
|
Sylmar
CA |
760 | 372 |
|
West Hollywood
CA |
760 | 375 |
|
Adelanto
CA |
760 | 294 |
|
Carson
CA |
760 | 290 |
|
Foothill Ranch
CA |
760 | 451 |
|
March Air Force Base
CA |
760 | 356 |
|
Oak Hills
CA |
760 | 388 |
|
Phelan
CA |
760 | 352 |
|
Piñon Hills
CA |
760 | 352 |
|
San Jacinto
CA |
760 | 293 |
|
Sunland
CA |
760 | 356 |
|
Wilmington
CA |
760 | 300 |
|
Woodbridge
CA |
760 | 293 |
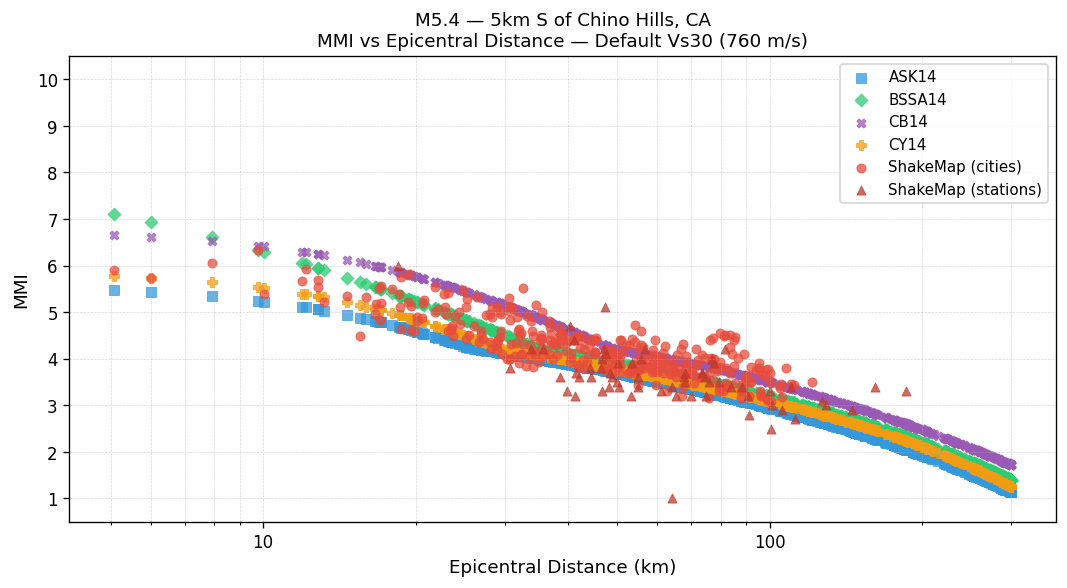
MMI vs Distance: Default Vs30 (760 m/s)
All methods using the 760 m/s rock-site reference. ShakeMap values are independent of Vs30.
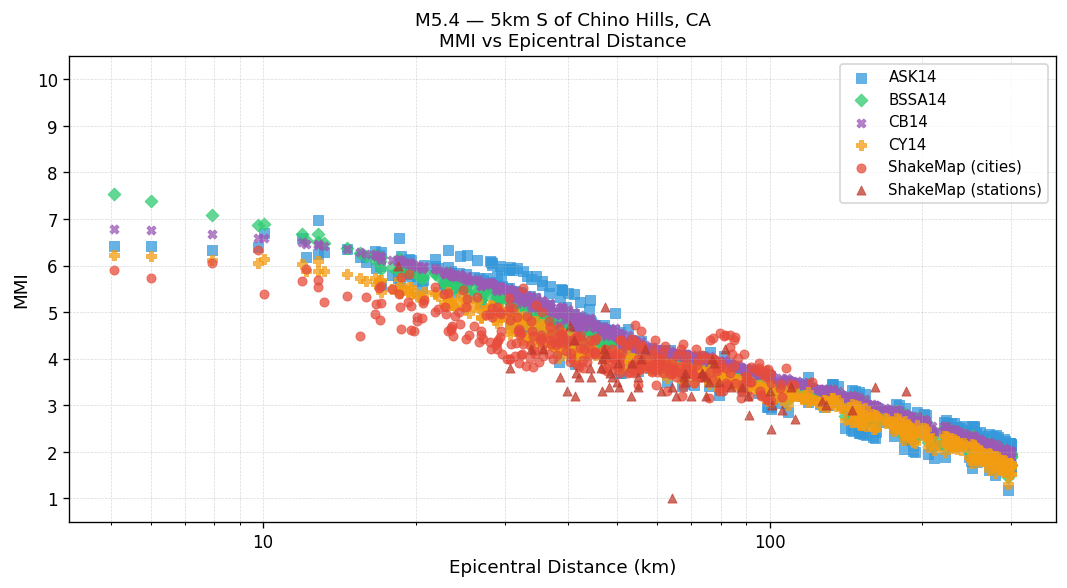
MMI vs Distance: Est. Vs30
GMPEs use the Est. Vs30 values shown in the table above. ShakeMap values are independent of Vs30.
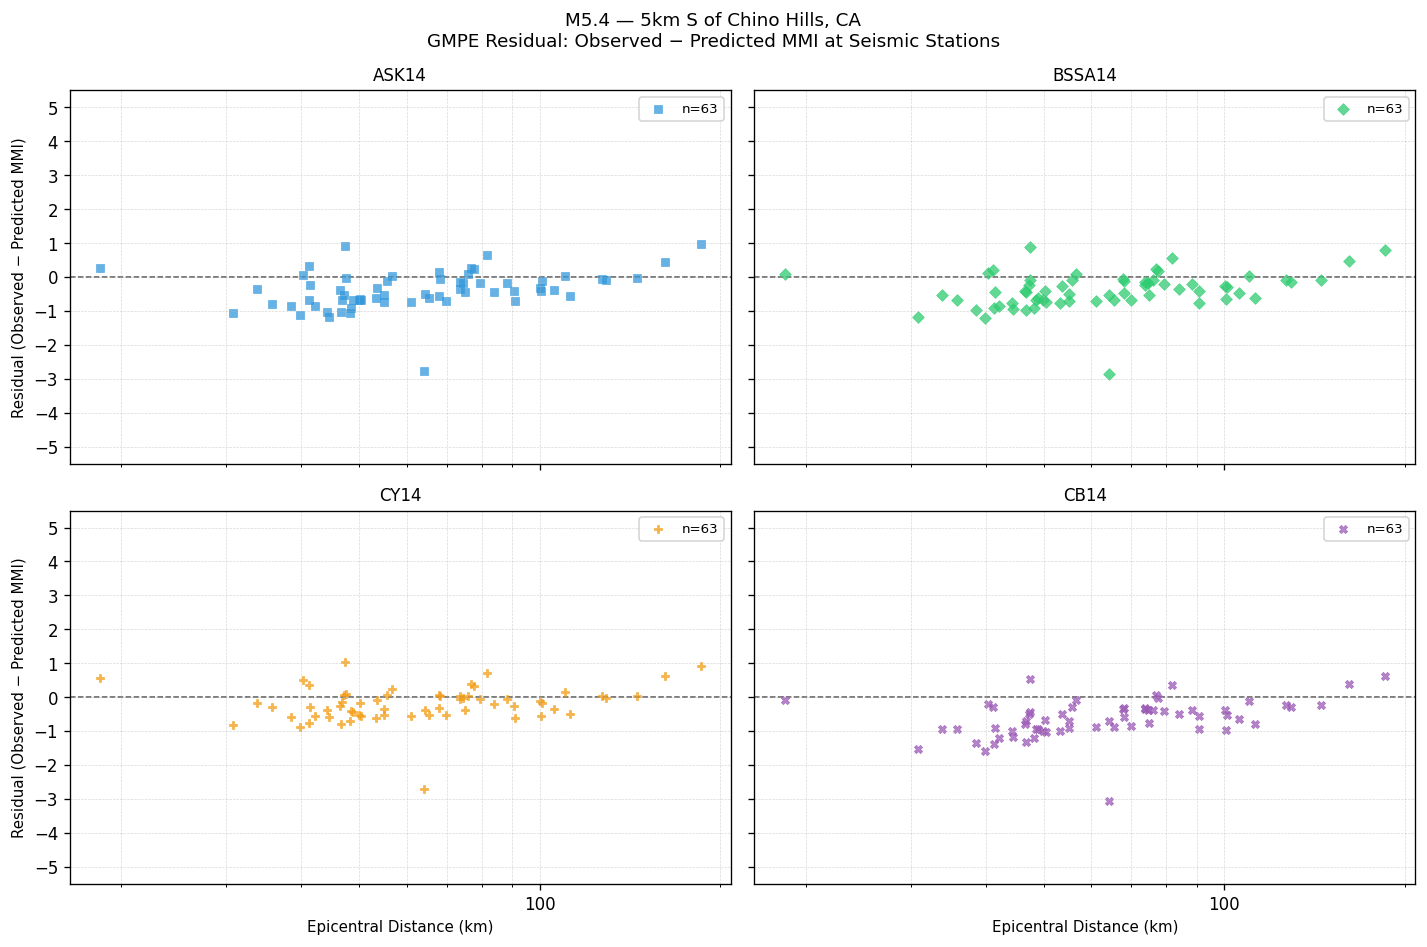
GMPE Residual: Observed − Predicted MMI
Signed residual at each seismic station. Positive values mean the GMPE underestimated shaking; negative values mean it overestimated. The dashed line at zero indicates perfect agreement.
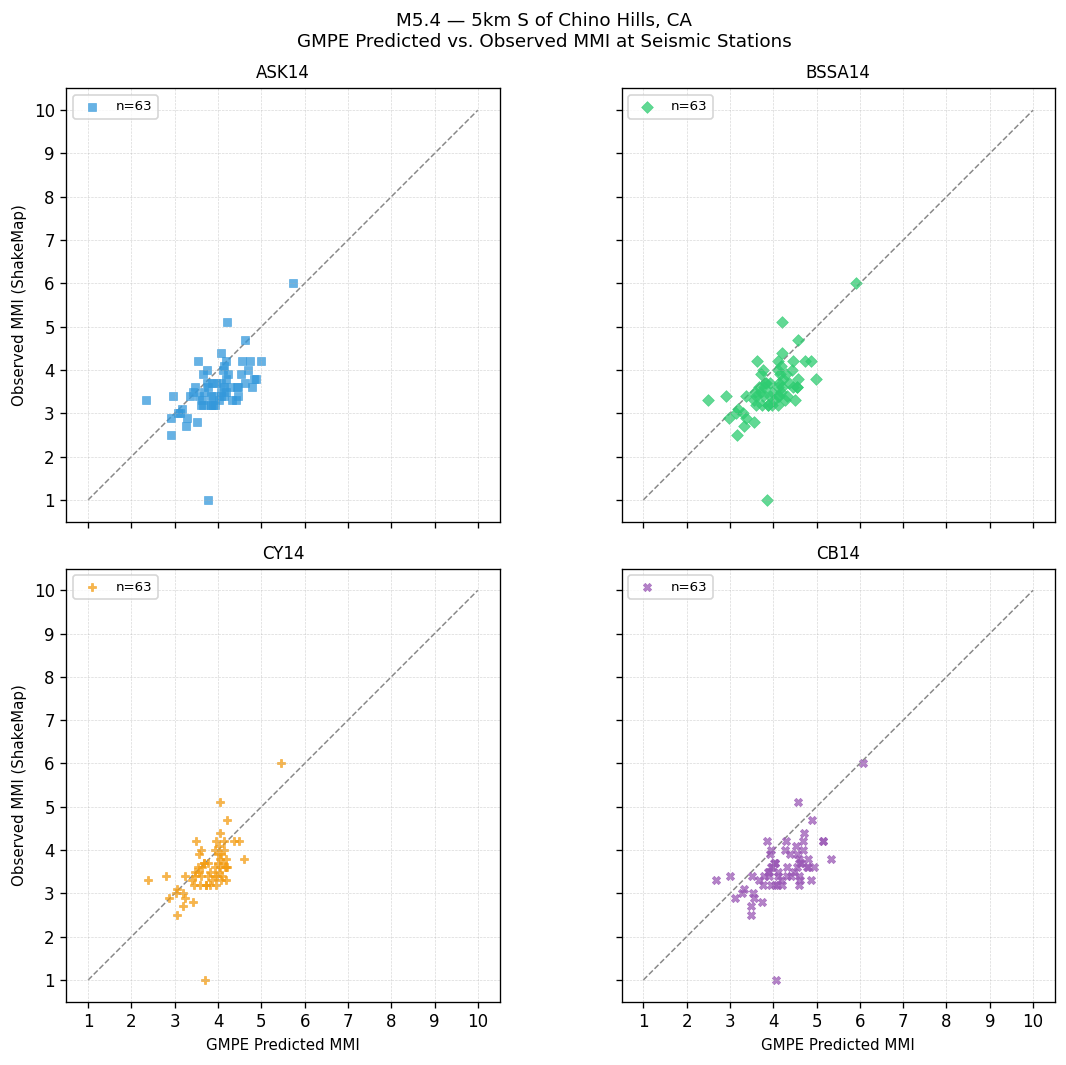
GMPE Predicted vs. Observed MMI at Seismic Stations
Each point is one seismic station. Points on the dashed 1:1 line indicate perfect agreement; above the line = GMPE underestimated shaking; below = overestimated.
GMPE Performance: Station Observations
Statistics computed by comparing each GMPE's predicted MMI against ShakeMap observed MMI at seismic stations. Bias = mean(observed − predicted). Lower RMSE indicates better overall agreement with instrumental measurements.
| GMPE | Bias | Sigma | RMSE |
|---|---|---|---|
| ASK14 | -0.39 | 0.56 | 0.68 |
| BSSA14 | -0.40 | 0.54 | 0.67 |
| CY14 | -0.21 | 0.53 | 0.56 |
| CB14 | -0.64 | 0.57 | 0.85 |
Peak Ground Motion: Seismic Station Observations
Recorded PGA and PGV at seismic stations, sorted by highest PGA. Top 25 stations shown. MMI (PGA) and MMI (PGV) are independent conversions via Worden et al. (2012) GMICE.
| Station | PGA (g) | MMI (PGA) | PGV (cm/s) | MMI (PGV) |
|---|---|---|---|---|
| CA:La Verne;Weymouth FP, Abut. (UNKNOWN.5164) | 0.1125 | Strong(VI) | 10.336 | Strong(VI) |
| CA: Lytle Creek; Fire Station (UNKNOWN.5409) | 0.0688 | Moderate(V) | 2.882 | Light(IV) |
| CA: Los Angeles; Acosta Resid (UNKNOWN.5396) | 0.0653 | Moderate(V) | 4.037 | Light(IV) |
| CA: San Bernardino; F S 10 (UNKNOWN.5339) | 0.0519 | Light(IV) | 1.530 | Light(IV) |
| CA: Los Angeles; 1100 Wilshire B (UNKNOWN.5233) | 0.0505 | Light(IV) | 5.468 | Moderate(V) |
| CA: Lake Mathews Dam (Tower) (UNKNOWN.707) | 0.0496 | Light(IV) | 1.111 | Weak(III) |
| CA: San Bernardino;FS No. 11 (UNKNOWN.5329) | 0.0483 | Light(IV) | 2.096 | Light(IV) |
| CA: Wrightwood; Post Office (UNKNOWN.5282) | 0.0469 | Light(IV) | 1.862 | Light(IV) |
| CA:Monterey Park;Garvey Resvr. (UNKNOWN.709) | 0.0465 | Light(IV) | 2.335 | Light(IV) |
| CA: Costa Mesa; Fire Station #4 (UNKNOWN.5286) | 0.0418 | Light(IV) | 2.302 | Light(IV) |
| CA: San Bernardino; Fire Sta. #9 (UNKNOWN.5330) | 0.0344 | Light(IV) | 0.909 | Weak(III) |
| Murrieta, Skinner Dam, Abutment (UNKNOWN.720) | 0.0326 | Light(IV) | 0.778 | Weak(III) |
| CA: Riverside; Mills FilterPlant (UNKNOWN.5275) | 0.0288 | Light(IV) | 0.484 | Weak(III) |
| CA:Granada Hills Porter RanchFS8 (UNKNOWN.5425) | 0.0287 | Light(IV) | 2.179 | Light(IV) |
| CA:San Bernardino; Sycamore FS (UNKNOWN.5036) | 0.0240 | Weak(III) | 0.969 | Weak(III) |
| CA: San Bernardino; MontecitoMem (UNKNOWN.5328) | 0.0239 | Weak(III) | 1.104 | Weak(III) |
| CA: Colton; Kaiser Medical Ctr (UNKNOWN.5341) | 0.0232 | Weak(III) | 1.071 | Weak(III) |
| CA:San Bernardino,Serrano School (UNKNOWN.5336) | 0.0226 | Weak(III) | 0.811 | Weak(III) |
| CA: Valyermo; Forest-Fire Sta (UNKNOWN.5031) | 0.0218 | Weak(III) | 1.559 | Light(IV) |
| CA:Reche Cyn,Olive Dell Ranch (UNKNOWN.5037) | 0.0218 | Weak(III) | 0.641 | Weak(III) |
| CA: Highland, Fire Station # 8 (UNKNOWN.5161) | 0.0215 | Weak(III) | 0.667 | Weak(III) |
| CA:San Bernardino; Verdemont Sch (UNKNOWN.5371) | 0.0210 | Weak(III) | 0.533 | Weak(III) |
| CA: Van Nuys Fire Station # 39 (UNKNOWN.5422) | 0.0206 | Weak(III) | 0.770 | Weak(III) |
| CA; San Bernardino F.S. #7 (UNKNOWN.5327) | 0.0205 | Weak(III) | 1.381 | Light(IV) |
| CA: Torrance; Fire Station 1 (UNKNOWN.5411) | 0.0204 | Weak(III) | 1.389 | Light(IV) |
Ground Shaking Intensities: Interpolated ShakeMap MMI
207 sitesSeismic Station Observed MMI
MMI values are derived directly from observed ground motion measurements at seismic stations and are not spatially interpolated.